• Skip to main content
  • Skip to footer

INT

Empowering Visualization

CONTACT US SUPPORT
MENUMENU
  • Products
    • Overview
    • IVAAP™
    • INTViewer™
    • GeoToolkit™
    • Product Overview
  • Demos
    • GeoToolkit Demos
    • IVAAP Demos
  • Success Stories
  • Solutions
    • Overview
    • For E&P
    • For OSDU Visualization
    • For Cloud Partners
    • For Machine Learning
    • For CCUS
    • For Geothermal Energy
    • For Wind Energy
    • For Enterprise
    • Tools for Developers
    • Services Overview
  • Resources
    • Blog
    • Developer Community
    • FAQ
    • INT Resources Library
  • About
    • Overview
    • News
    • Events
    • Careers
    • Meet Our Team
    • About INT

Uncategorized

Jun 23 2022

Meet Our Summer Interns!

Four talented and motivated students have recently joined the INT team to be a part of our Summer Internship Program. The program provides an exciting opportunity to contribute to developing new projects and gain fresh insight into the energy industry. 

This summer, our Software Developer Interns will be applying what they have learned so far in school to tasks related to INT’s core products — GeoToolkit and IVAAP. Also, being able to work at an international company with developers from many backgrounds gives them the opportunity to expand their network and work with mentors internationally.

How’s It Going So Far? 

Reflecting back on their first week, here are some highlights so far: 

Angela Cao, a Master’s in Data Science candidate at Rice University, is our Data Science Intern who will be focusing on developing, improving, and implementing machine learning algorithms and techniques in IVAAP. She says, “The best highlight so far is whenever a model or algorithm that we have spent time working on is working successfully or improved in performance. I think celebrating and appreciating the small wins will make us look forward to the bigger victories that will come soon enough.” 

Letian Zhang is working on his Master’s in Computer Science at Rice University and is our Software Development Intern focusing on 3D. Letian is optimizing seismic rendering for GeoToolkit. For him, the best thing so far is the mentorship here at INT: “When I don’t understand a concept, my mentor always provides me with some detailed explanations and carefully makes sure I understand the concept so I can learn how things work behind the scenes.” 

Machine Learning Intern Olivier Kuhn de Chizelle is pursuing his Master’s in Data Science and Analytics from Georgetown University. He’s working on implementing new and improving existing Machine Learning tools supported in IVAAP. “I just joined the team, and from Day One, everyone has been incredibly welcoming and kind — the type of environment in which you want to perform your best!”  

When Software Development Intern Thibault Tonnel, who studies engineering at UT-Austin, was asked to reflect on his first couple of weeks at INT, he said: “I love how nice everyone has been, both in-person and remotely. I have already learned a lot and I am very excited for what’s to come!”


Interns1


Welcome to the team! We are so excited to see what this talented and fun group of students will be able to accomplish this summer — and in their bright futures ahead! 


Filed Under: Uncategorized

Jan 26 2022

Raster Log and TIFF Rendering in the Cloud with GeoToolkit.JS

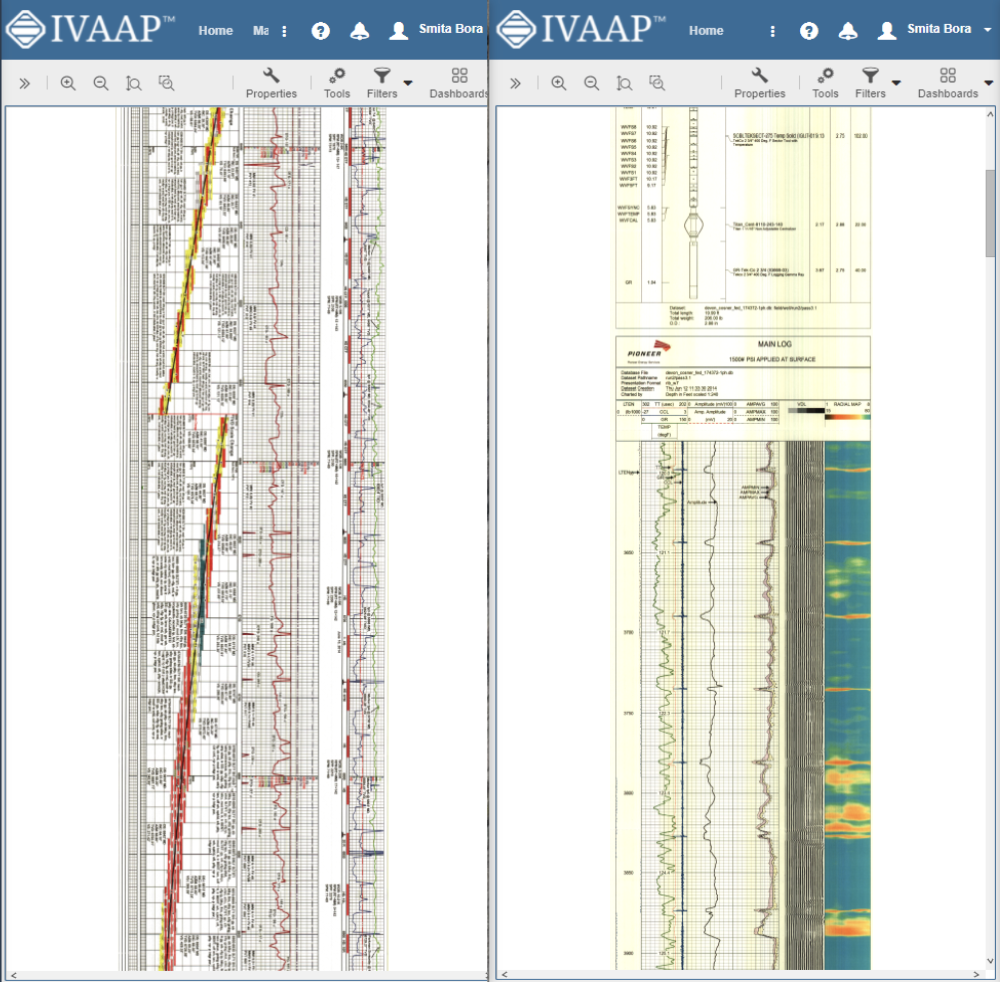
A common challenge that our users face is a need to render and display huge images like raster logs and GeoTIFF files. Interactions occur in the client’s server architecture, and while these images can be stored in the cloud or on a server, they are usually very large files, making it difficult to move from the server to the client. It is also time-consuming to read data from the cloud and unpack operations for TIFFs.

When trying to open these files, the user may have to wait up to several minutes to start to receive data from the server. This can lead to a poor user experience because the client doesn’t know if a server is working or if it’s already halted the solution that we applied. So we wanted to improve this for our users.


Reducing Calculation Complexity

In order to optimize several areas for the client as well as on the server, we decided to focus on the server data loading from cloud storage and enhance the unpacking of TIFFs. We found a way to minimize the number of requests from client to server and pass more calculations from server to client, reducing the calculation complexity on the server.

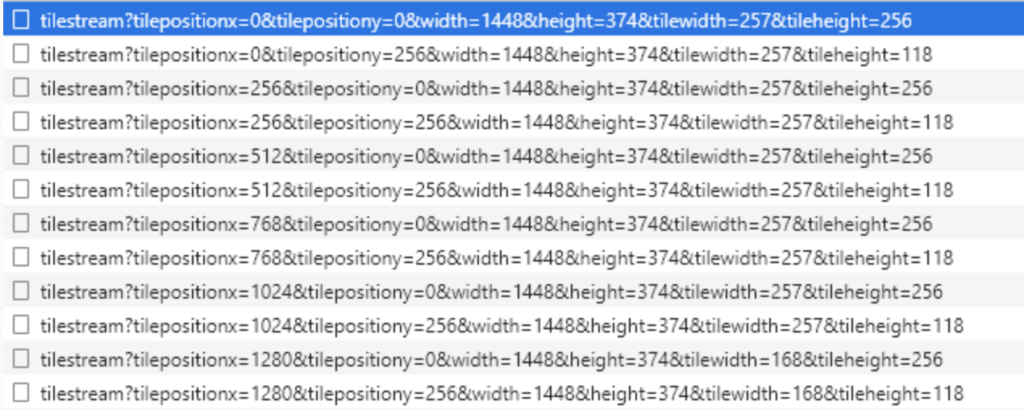
So, how did we do it? On the client side, we have a class called tiled shape which requests tiles from the server.

raster 1

For each tile, the client requests its X and Y position, height, and scaling. In the past, when a user would interact with an image and send a request to the server, requesting new tiles, it would be too much for the server to handle, causing even more delays.

To minimize the impact this request has on the server, we decided to check if the  user stops interaction by timer. After any interaction on the client’s side with the image, we start a timer. Before the timer is up, if no requests are sent from the client to the server, this timer finishes quickly and the image loads. This allows us to minimize the number of requests from client to server.

Calculation and Caching

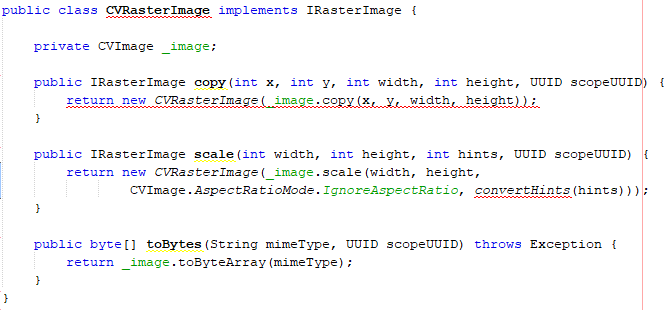
Another feature we optimized is the ability to pass information from the server to plan calculations for the correct tile position and correct tile transformation. By passing the data from server to client, the client calculates the correct position for tile on each side. We also use a cache of tiles on the client side to ensure that we do not request the same tiles. Image cache on a server side is also possible, but after the first request, it is necessary to download the requested image from the cloud, unpack the image, and then start to copy and scale the requested tile to convert this image.


Unpacking the Image

On the server side, we implemented TIFF unpacking on a highly performing native implementation. This is a multithreaded and thread safe solution., which allows us to deal with several requests from clients at the same time. As a result, a large TIFF image file can be stored in the cloud without a problem and an unpacking time of less than four seconds compared to the previous solution’s 60 seconds. We also optimized the cloud access speed on the server side by renting a high-performance AWS instance with high-speed access to AWS cloud storage. This allows us to download the whole TIFF image from the cloud in less than three seconds, making the download speeds about 800 megabytes per second.


raster2

Faster Rasters

As a result, we spend around three seconds to download the image from cloud storage and about four seconds to unpack the image. So it only takes roughly seven seconds to download, unpack the image, deal with client requests, scale the requested tiles, and send them back to the client as opposed to having to wait several minutes to possibly hours for the same process.  Overall, this process greatly improves the user experience.

The new raster logs and cloud TIFF rendering are just one of the many new features and improvements from the latest GeoToolkit.JS 2021.1 release.

To learn more about GeoToolkit.JS 2021, please visit int.com/products/geotoolkit/or contact us at support@int.com.


Filed Under: GeoToolkit, Uncategorized Tagged With: cloud, geotiff, raster, TIFF

Dec 02 2020

IVAAP Release 2.7: More Map Search and ArcGIS Features

IVAAP™ is a subsurface data visualization platform that provides developers and product owners powerful subsurface visualization features for their digital solutions in the cloud. IVAAP enables users to search, access, display, and analyze 2D/3D G&G and petrophysical data in a single user-friendly dashboard on the web. The latest release of IVAAP 2.7 comes with various new features and significant improvements.

Highlights from this release include many advanced search and map capabilities, improved 3D widget filter dialog, new interval curves support, new date/time picker for Cross-Plot widget axis settings, and more! 

Advanced Mapping Capabilities

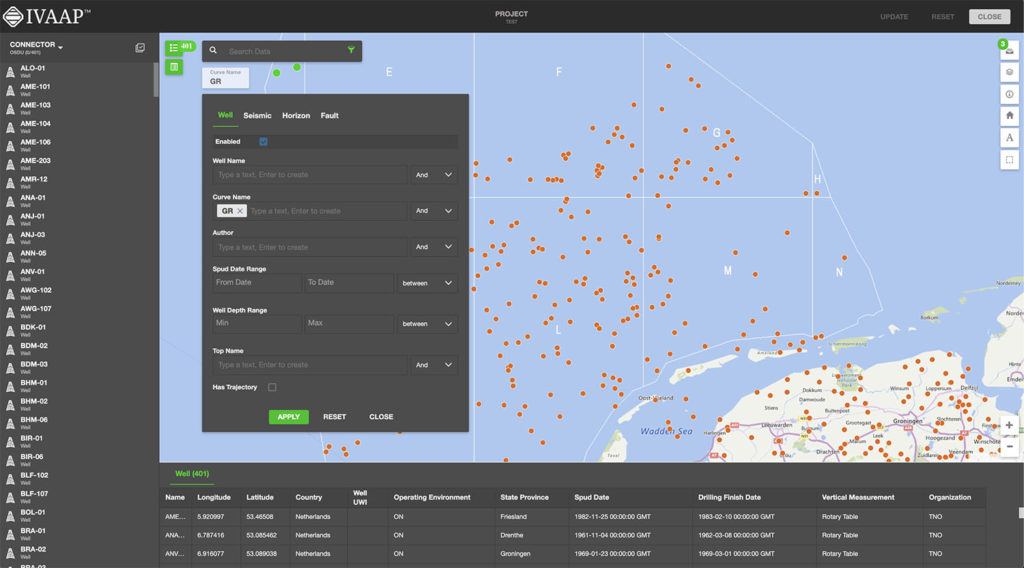
IVAAP features support for visual-based data discovery using map-based search, and is fully integrated with ArcGIS (ESRI), allowing for the search of structured and unstructured data in a data lake or any other file repository. IVAAP supports a wide range of map formats and services like ArcGIS, GeoJSON, KML, Mapbox, Bing, WMS, and more.

With the ArcGIS integration, you can easily access all layers and details from your ArcGIS server and display them within IVAAP to enrich map-based search of well, seismic, and other subsurface data.

New features include the ability to display a dynamic metadata table for a selected object in the map (Well, Seismic, etc.). 

Most layers are supported. Image services (ArcGIS Image Service Layer, Image Services Vector Layers, and WMS) and Tile services (Image Service, ArcGIS Tiled Map Service Layer, Web Tiled Layer, OpenStreetMap) are supported. Feature Services include map service (ArcGIS Feature Layer), KML, WFS, and CSV. We also provide some real-time services support like stream services (ArcGIS Stream Layer), GeoRSS, Vector Tiles (VectorTileLayer), and Bing Maps services. Two extra formats that are supported are GeoJSON and GPX.

This release includes improved search capabilities allowing search across any metadata for any user. Access to data can be restricted to read-only mode. We also made improvements to fence highlighting and access to well lists, and labels can now be saved with the dashboard.


2_7_0_Map Reduced


More Themes Control 

Previously, theme control within IVAAP was a bit limited. We’ve expanded the theme mechanism to all widgets so that users can customize themes with more control and options and access new updated themes.


2_7_0_Customized Themes

Lightmode theme


New Image Widget 

IVAAP can now display simple image files such as jpeg or png files in the image widget, align, and zoom in to show detail. This feature allows users to customize dashboards with logos or other image files needed to display. 

Improvements in 3D

IVAAP’s 3D widget now supports tagging and aliases when displaying well data. We added reservoir data that can be serialized in the dashboard template. Users now have the ability to mix data with CRS and data without CRS. Another new feature is that users can apply properties to multiple or individual objects. And we’ve improved the dashboard restoration of multiple inlines, crossbones, and time slices. Finally, the 3D widget filter dialog has been redesigned.


2_7_0_3D Reduced


New Features in WellLog

For WellLog, we improved the set main index support for templates, dashboards, and well switching. With this improvement, a secondary index can be used to display data into a different index and secondary indexes can be restored when opening an existing dashboard or template. An improved automatic logarithmic mode gives users the ability to add a curve to a logarithmic track. New features added to WellLog include: the ability to automatically rotate labels for lithology and a reset action where users can right-click with the option to clear their display.


WellLog


New in Schematics

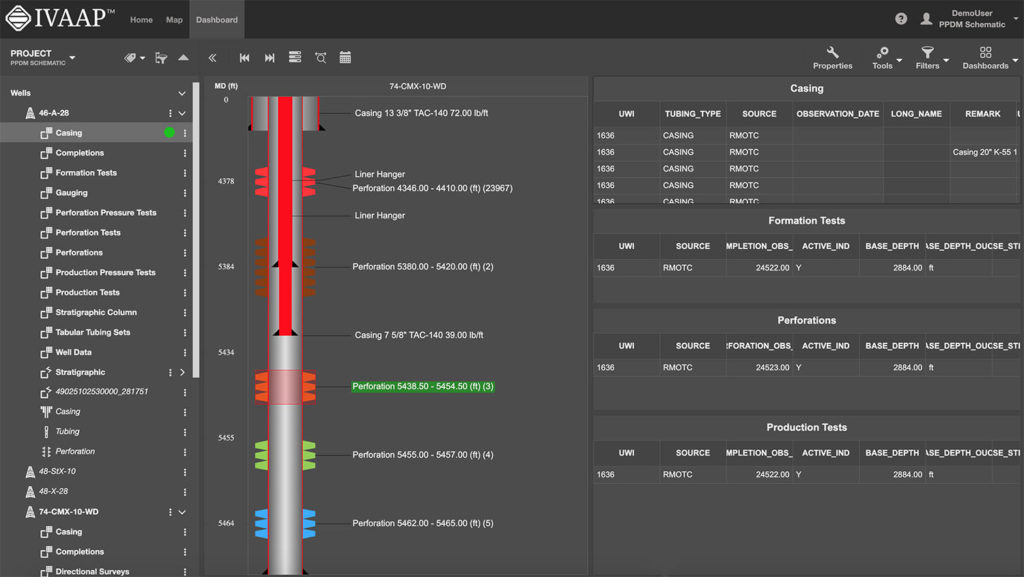
For the Schematics package, new features include: perforation with state definition support, the ability to customize by using a filter dialog, and the ability to use cursor tracking between Schematics and WellLog. We also improved the component selection support in the Schematics widget.


schematics 2.7


Time Series: Annotations and Perforations 

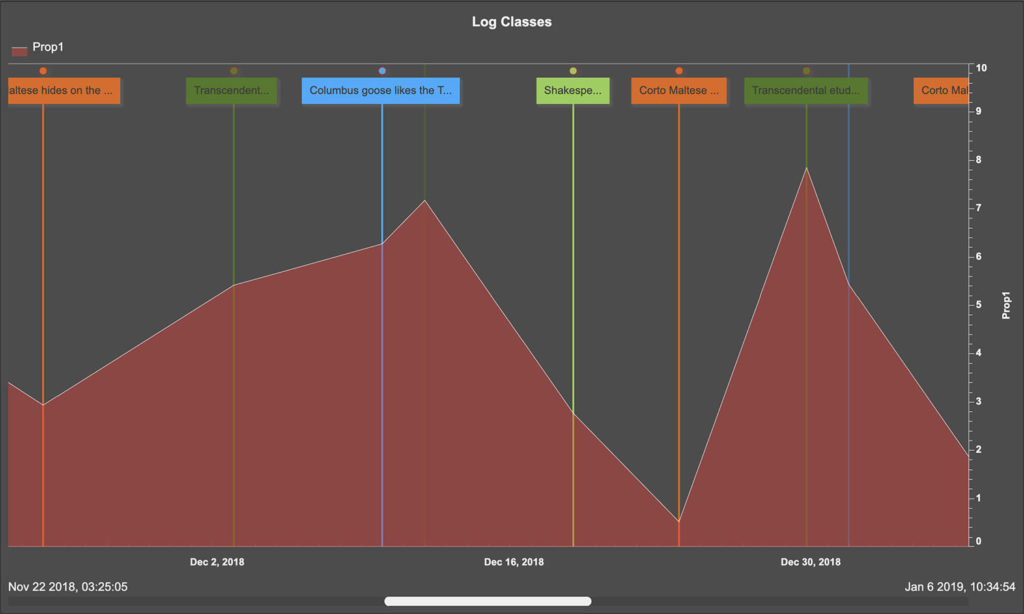
We improved the ability to select a data series from the legend. The Time Series widget now features support for annotations and perforations. The tooltip now shows the index data and time.


TimeSeries


New and Improved Line Chart

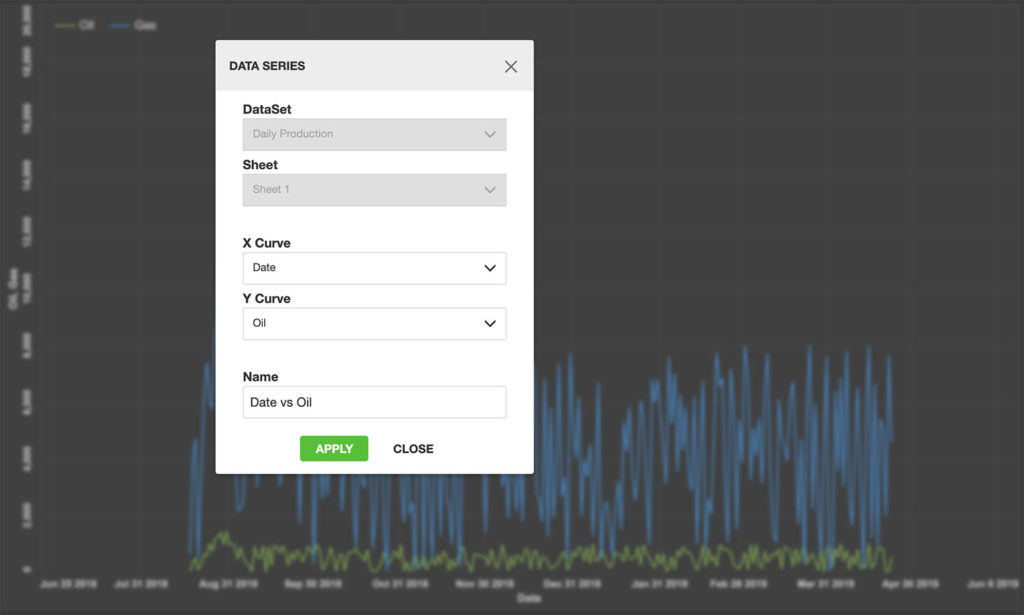
The IVAAP line chart now supports templates and data series dialog. We improved the ability to edit existing data series. Users can now flip the axis for date and time data, and the legend has been improved to show or hide the data series parent. There is also an improvement for single data sets, multi-data sets, and multi parent projects. 


LineChart


This release includes many more improvements to features and to the UI. For more information, check out the full release here.

Or check out int.com/ivaap for a preview of IVAAP or for more information about INT’s other data visualization products, please visit www.int.com or contact us at intinfo@int.com.


Filed Under: IVAAP, Uncategorized Tagged With: 3D, annotations, arcgis, CRS, ivaap, line chart, mapping, schematics, time series, welllog

May 21 2020

INT Releases Latest IVAAP Version Supporting OSDU Release 2

IVAAP on OSDU R2 supports seismic visualization, data aggregation with unparalleled performance in the cloud to serve large seismic volumes using IVAAP’s HTML5 technology combined with OpenVDS format.

HOUSTON, TX — May 21, 2020—Interactive Network Technologies, Inc. (INT), a leader in advanced HTML5 domain visualization in oil and gas, is pleased to announce their contribution to the new release of The Open Group’s Open Subsurface Data Universe™ (OSDU) Data Platform Release 2.

The OSDU R2 release integrates INT’s robust seismic visualization capabilities and Bluware’s open source Volume Data Store (OpenVDS). Additionally, INT contributed a Java-native interface wrapper to support the adoption of OSDU across the industry. OpenVDS and IVAAP™ work together to support fast rendering of large seismic dataset in the cloud in 2D and 3D views. 

INT’s enterprise upstream visualization platform, IVAAP, enables full data aggregation and visualization of domain data across multiple cloud platforms and data storage. Using a microservices architecture, IVAAP supports most industry data standards, including OSDU, PPDM, WITSML, and several commercial databases, and enables user co-visualization. IVAAP’s unique dashboard capabilities combine data types—real-time, historical, 2D/3D seismic, reservoir, and more—to provide a unified view of exploration, drilling, and production operations in a web browser. 

INT collaborates closely with the OpenSDU team to help validate the platform and create a powerful framework that developers can embed to deliver cloud-based digital solutions much faster than ever. Using the powerful OSDU search and delivery API, IVAAP allows users to search, find, display, and analyze data on the fly, including log, trajectories, tops, seismic, horizon and fault data. 

Creating a common environment hosted in the cloud enables oil and gas companies to efficiently access massive amounts of data, reduce data silos, collaborate remotely, implement machine learning (ML), and lower the cost of operations.

“Working closely with The Open Group, IVAAP made it possible for users to visualize seismic data. We are very proud of the work the team—including our partner Bluware—has done to ensure IVAAP offers the best possible user experience and the fastest data visualization and aggregation. Interacting with a 100G+ 3D seismic volume in a web browser with great performance is now possible,” says Dr. Olivier Lhemann, founder and President of INT. 

Read the press release on PRWeb >

For more information on INT’s newest platform, IVAAP, please visit www.int.com/products/ivaap/

Open Subsurface Data Universe™ and OSDU™ are trademarks of The Open Group.

Filed Under: Uncategorized Tagged With: Bluware, ivaap, openVDS, OSDU

Aug 09 2019

In Retrospect: 10 Years at INT

This month of July marks a significant personal milestone since I have worked at INT for 10 years. 10 years is a long time, especially in technology where paradigm changes occur approximately every three years. Yes, the word “paradigm” was actually in vogue the year I started at INT—that’s how long it’s been. For this anniversary, I’d like to take you on a chronological tour of my experience.

The Formative Years

The first two years at INT were spent learning the many aspects of the application and the science I was working on: INTViewer and subsurface data. I liked joining a new team and getting acclimated to a new code base. I learned a lot from INTViewer’s architect. For example, he helped me understand the significance of making aspects pluggable. Not only does it serve INTViewer as a platform, but it allows the code to evolve without getting out of control. Following this principle, INTViewer’s code base has been able to grow several folds. And we’ll see that the plugins approach served me well in other projects over the course of 10 years.

Growing with INTViewer and INTGeoServer

After the first two years on the job, I picked up more responsibilities. Becoming the “ultimate resort for INTViewer questions” affected me in a way I didn’t anticipate. When I first started, whenever someone asked me a question I could not answer, my internal dialogue went something like, “I don’t know that part of the system. Who is the best person to ask for help on this?” After two years, this changed to: “I have been in this situation before. I know I will find the answer.” This somewhat irrational belief that I can answer any question thrown my way has helped me quite a bit when it comes to solving problems and helping others. When a coworker has a tough technical question, I didn’t anticipate I would one day answer, “Let’s find out!” with such confidence.

The needs of INT’s customers have changed over 10 years. One particular concern that has been pervasive across that time period is the ubiquity of data. Before “cloud” became the new word in vogue, customers often came to me with this problem: “I have teams all across the world, but I don’t want to maintain a worldwide file system. Visualization needs to be fast for all, without having to duplicate data. What do I do?” It’s out of these conversations that INTGeoServer, another pluggable platform, came to be.

INTViewer had years of experience built in to how to access data files efficiently, but, as a product, it needed to move beyond the file system. This was a complex technical challenge and an opportunity to widen the team’s technical skills.

INT gave me other opportunities to innovate: the integration of Python with INTViewer is quite unique in the market. Looking back, even though the technical solutions to reach “data ubiquity” have changed over the years, even though we introduced new ways to automate geoscience workflows, the fundamental work on geoscience data hasn’t evolved much. While software can be a scary place with its rate of change, I find that the geoscience learnings from my first two years are still relevant.

Building IVAAP and the Future of Ubiquitous Data

The latest evolution of ubiquitous data is cloud-based. The last three years have been a sort of new beginning for me since I’ve been tasked with leading the data side of IVAAP. Most of the IVAAP backend was essentially written from scratch, which is very satisfying as a developer. What is even more satisfying was working with the development team and seeing it grow. Since the backend was written by this team, there is no longer an “ultimate resort for questions” role. With the recent work with the OSDU consortium, I am happy and proud that the architectural decisions we made over the last three years have shown we are going in the right direction. This was recently validated by making IVAAP compatible with the OSDU platform. This work didn’t require any changes to IVAAP’s SDK—IVAAP’s OSDU implementation is actually just a plugin for this backend.

A Developer Culture

Working on INTViewer, INTGeoServer, and IVAAP for a grand total of 10 years, what has made me show up every morning has been the deep technical aspects of the job, the products I have been able to work on, and the people I interact with. INT has been a wonderful opportunity for me because of its technological leadership. If a developer says “I need X to achieve Y,” this gets immediate attention because the company culture is very developer-friendly. If you are a developer at heart like I am, being able to write code all day without interruptions is a significant perk of the job. Frankly speaking, these 10 years were also possible because developers at INT are seen as an investment, not a cost. Unlike other companies, INT has a strong will to weather tough economic cycles without shrinking its staff. I have grown with INT, and we both keep growing together (we are hiring, by the way). As a leader, I strive to help today’s new hires to have the same positive experience I had.

Filed Under: Uncategorized Tagged With: careers, developer, INT career, INTGeoServer, INTViewer, ivaap

  • Go to page 1
  • Go to page 2
  • Go to page 3
  • Go to Next Page »

Footer

Solutions

  • For E&P
  • For OSDU Visualization
  • For Cloud Partners
  • For Machine Learning
  • For CCUS
  • For Geothermal Energy
  • For Wind Energy
  • For Enterprise
  • Tools for Developers
  • Customer Success Stories

Products

  • IVAAP
  • GeoToolkit
  • INTViewer
  • IVAAP Demos
  • GeoToolkit Demos

About

  • News
  • Events
  • Careers
  • Management Team

Resources

  • Blog
  • FAQ

Support

  • JIRA
  • Developer Community

Contact

INT logo
© 1989–2023 Interactive Network Technologies, Inc.
Privacy Policy
  • Careers
  • Contact Us
  • Search

COPYRIGHT © 2023 INTERACTIVE NETWORK TECHNOLOGIES, Inc