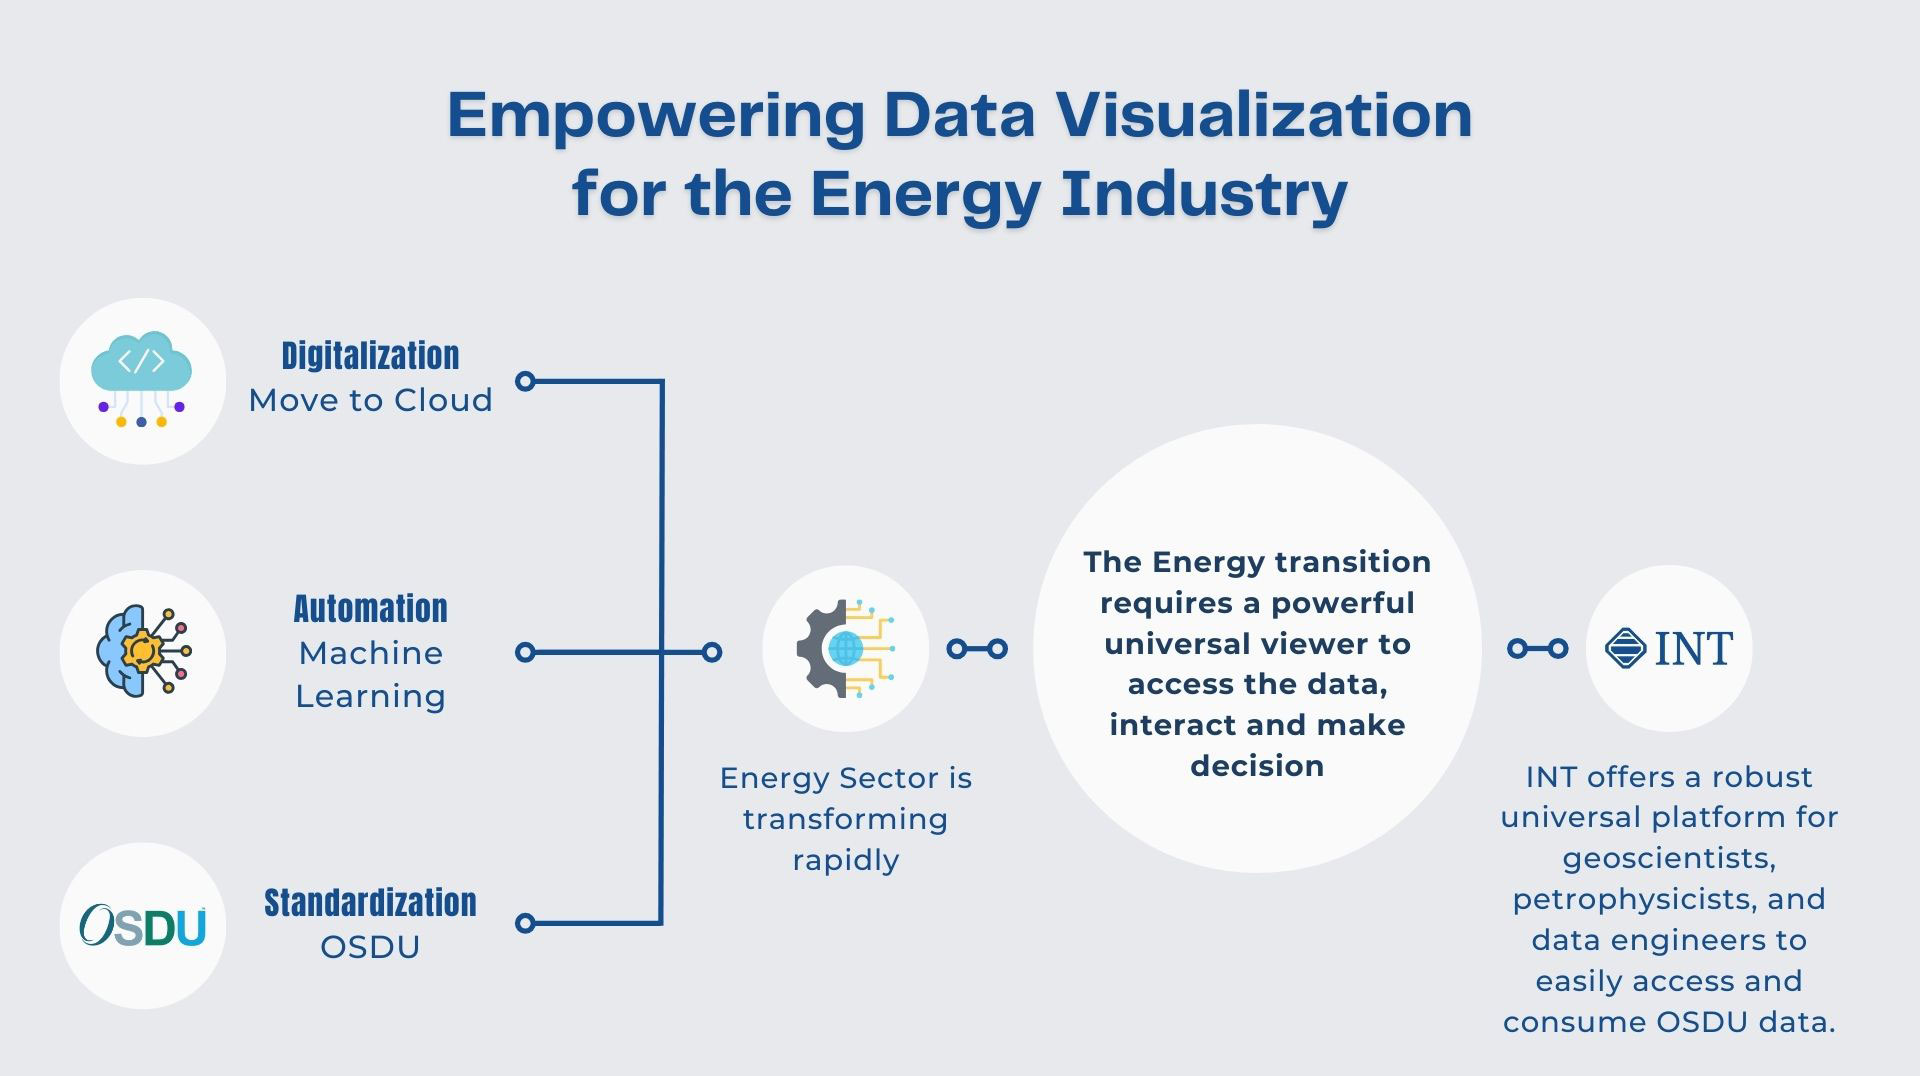
In the Energy industry, understanding how reservoirs change over time is crucial for maximizing production and optimizing recovery strategies. 4D seismic, or time-lapse seismic, provides valuable insights into these dynamic changes, but effectively managing, visualizing, and analyzing multi-vintage seismic data can be a challenge.
Most companies that acquire and process seismic data may have multiple copies of data stored in different locations or visualized in different systems, making it difficult to find, visualize, compare, and trust the data cleanly and easily.
That’s where IVAAP comes in.
IVAAP: Empowering 4D Seismic Visualization
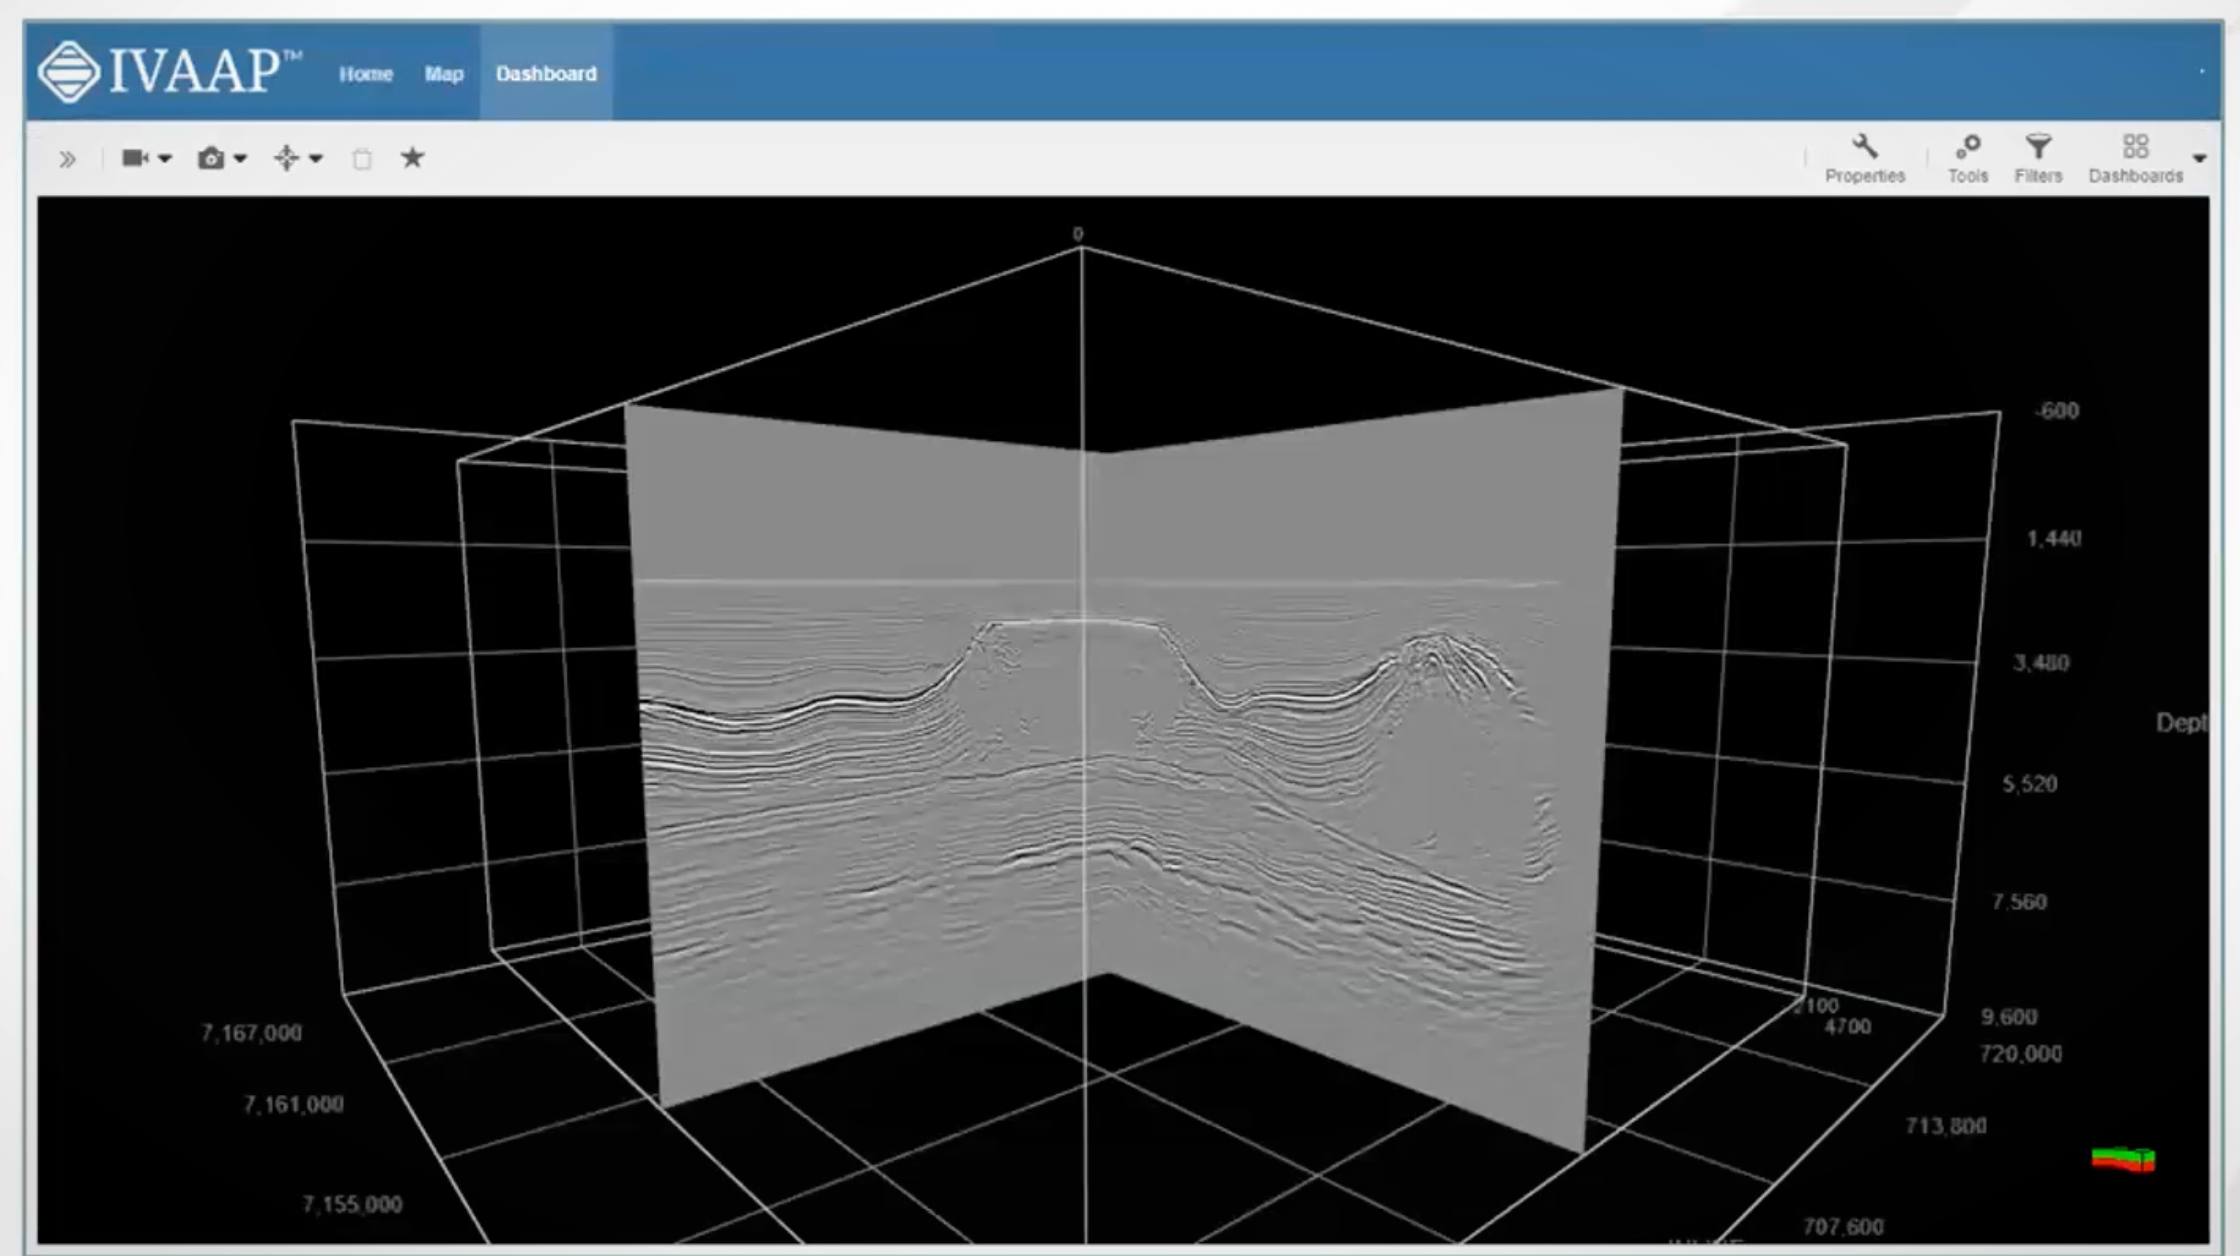
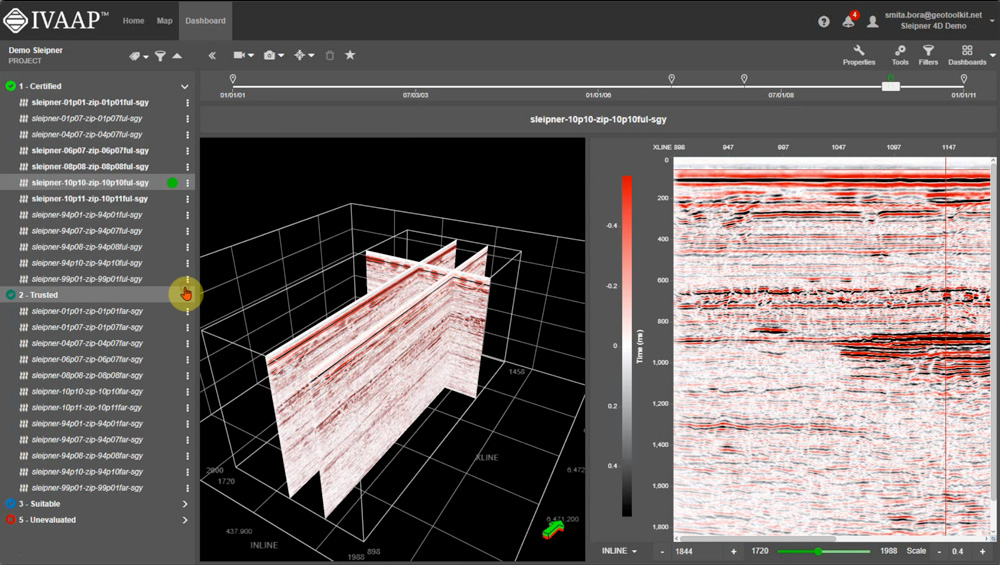
IVAAP makes 4D seismic visualization incredibly intuitive. It streamlines 4D seismic workflows by enabling geoscientists and engineers to combine their seismic data in one platform. You can select and navigate between seismic datasets using a time slider, quickly visualizing changes in those datasets over time. With this easy-to-use interface, engineers and geoscientists can:
- Visualize reservoir changes: Easily compare and analyze seismic data acquired at different times, revealing changes in fluid movement, pressure, and saturation.
- Identify bypassed hydrocarbons: Pinpoint areas of untapped potential by visualizing unswept zones and bypassed hydrocarbons.
- Optimize production strategies: Make better informed decisions about well placement, injection strategies, and enhanced oil recovery (EOR) techniques based on 4D seismic insights.
- Collaborate effectively: Share interactive visualizations and interpretations with colleagues, fostering a deeper understanding of reservoir dynamics.
Ensuring Data Integrity and Streamlining Workflows
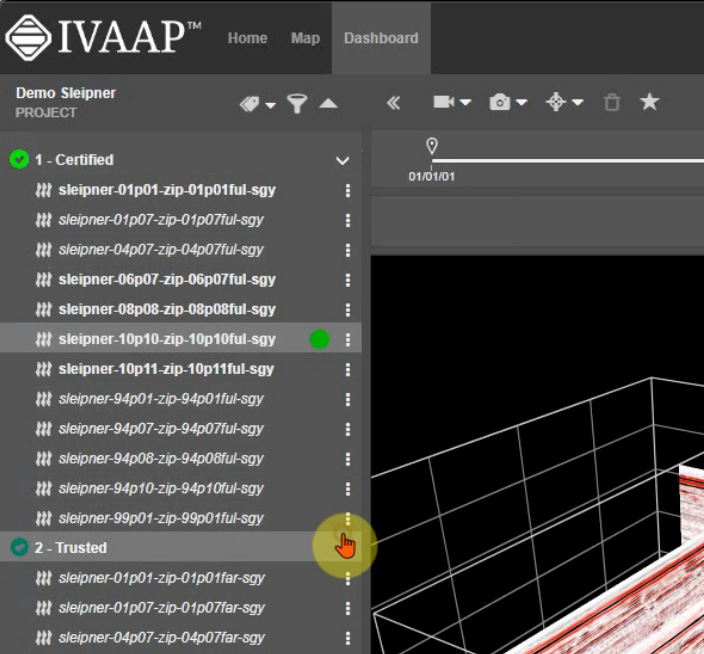
Imagine having the confidence to make critical decisions based on data you know is reliable. IVAAP’s QC tools do more than just flag issues; they let you filter and visualize only the data that meets your standards, including data stamped with technical assurance by OSDU. So, when it’s time for a technical review of well proposals stored on OSDU, for example, you can easily see what’s been certified and focus your analysis on the most trustworthy information. This means smoother workflows, quicker approvals, and greater confidence in your subsurface interpretations.
Benefits of IVAAP for 4D Seismic Analysis
With IVAAP, you can finally say goodbye to data silos and hello to seamless collaboration. Share your 4D seismic visualizations with your team, work together on interpretations, and make data-driven decisions with confidence. This collaborative environment, coupled with IVAAP’s efficient data management and analysis tools, leads to increased productivity and reduced time spent on tedious tasks.
Ultimately, IVAAP contributes to enhanced recovery by enabling the identification of bypassed hydrocarbons and the optimization of production strategies. This helps maximize recovery rates and extend the productive life of oil and gas fields, generating greater economic returns and contributing to a more sustainable energy future.
By providing a comprehensive platform for visualization, integration, and collaboration, IVAAP enables efficient reservoir management, optimized production, and ultimately, increased profitability.
To see how IVAAP can improve your 4D seismic workflows, request a demo today.