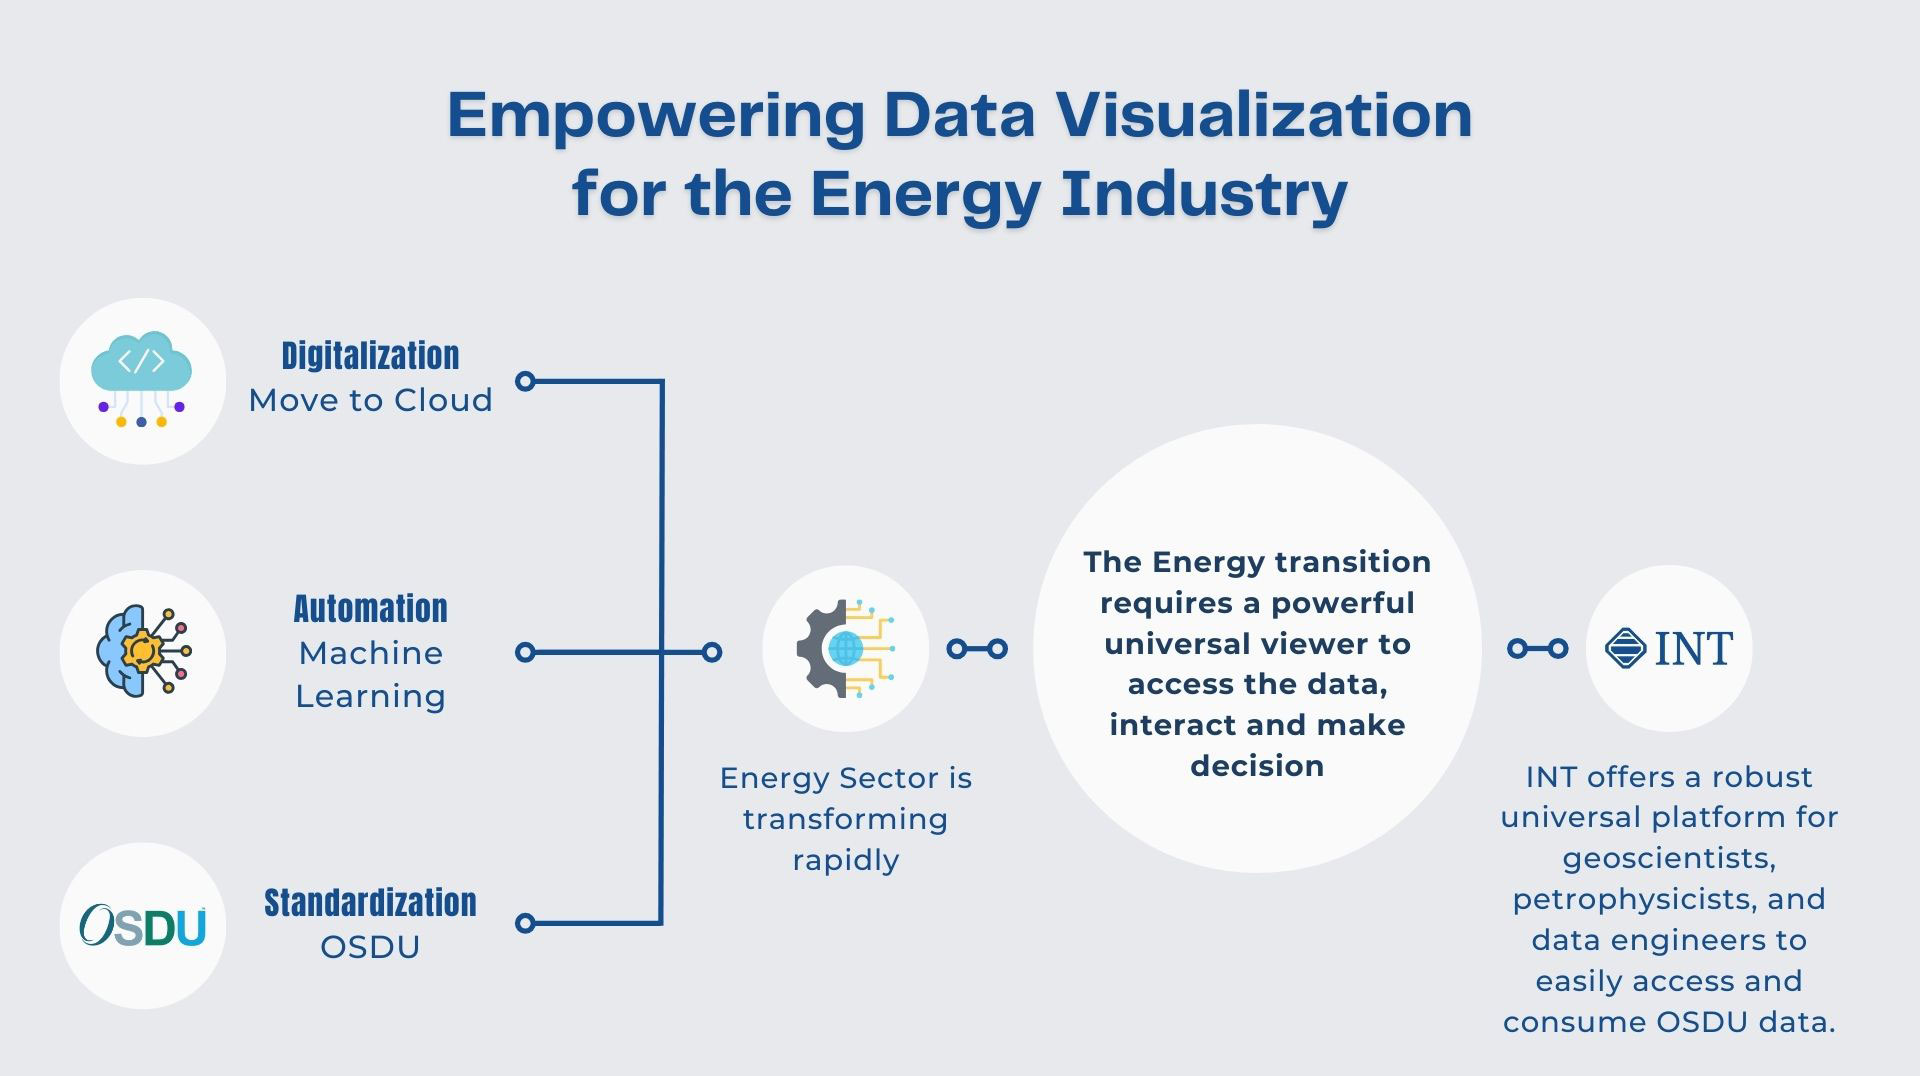
In the world of geospatial analytics and subsurface interpretation, streamlined access to vast seismic datasets is crucial. The rise of the Open Subsurface Data Universe™ (OSDU™) has propelled the development of innovative formats like OpenZGY and OpenVDS, designed to optimize seismic data storage and retrieval. As an active member of OSDU™, INT is committed to empowering our users with cutting-edge tools, which is why we’ve seamlessly integrated support for these essential OSDU formats within our platform.
The Limitations of Traditional Seismic Data Formats
As we explore deeper and more complex geological structures, the amount of seismic data collected continues to skyrocket. Unfortunately, traditional seismic data formats, such as SEG-Y, often struggle to handle this ever-growing volume effectively. These formats typically store data in a linear fashion, leading to several limitations: slow access times, limited scalability, and interoperability issues.
The OpenZGY and OpenVDS Revolution
OpenVDS and OpenZGY represent a revolutionary approach to seismic data storage and retrieval, addressing the limitations of traditional formats. Here’s how they transform data handling:
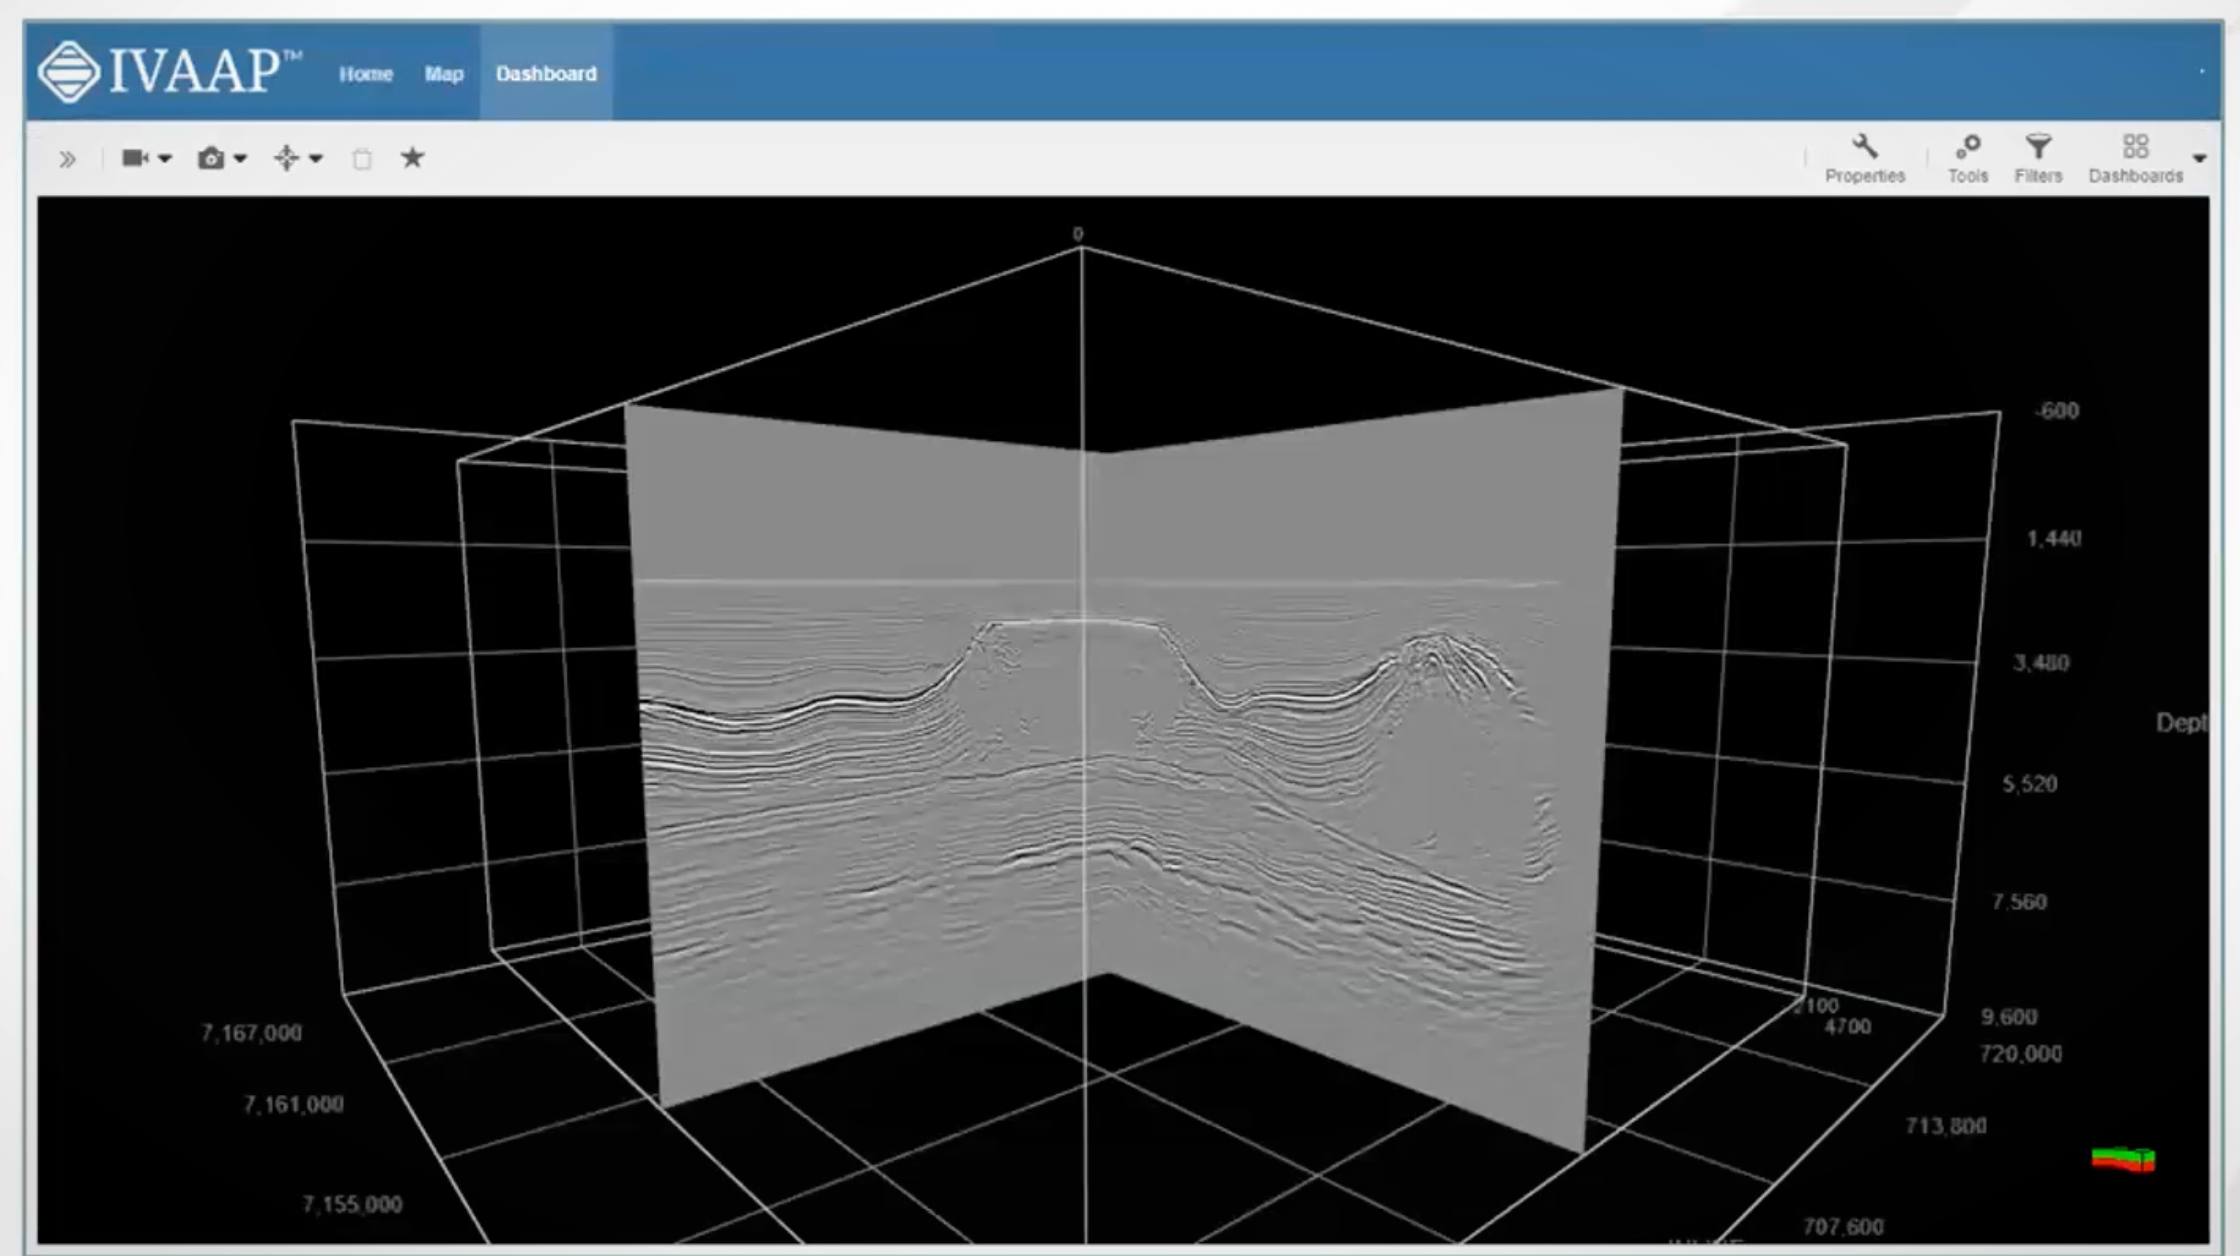
- Superior Performance: These formats organize data into “bricks” and further into “micro-bricks,” enabling lightning-fast access in all directions (inline, crossline, and Z-slice). Projects utilizing OpenZGY and OpenVDS benefit from unparalleled responsiveness.
- Enhanced Collaboration: As OSDU-compliant formats, OpenVDS and OpenZGY foster easy data exchange and knowledge transfer among teams and organizations. This breakdown of data silos leads to more informed decision-making.
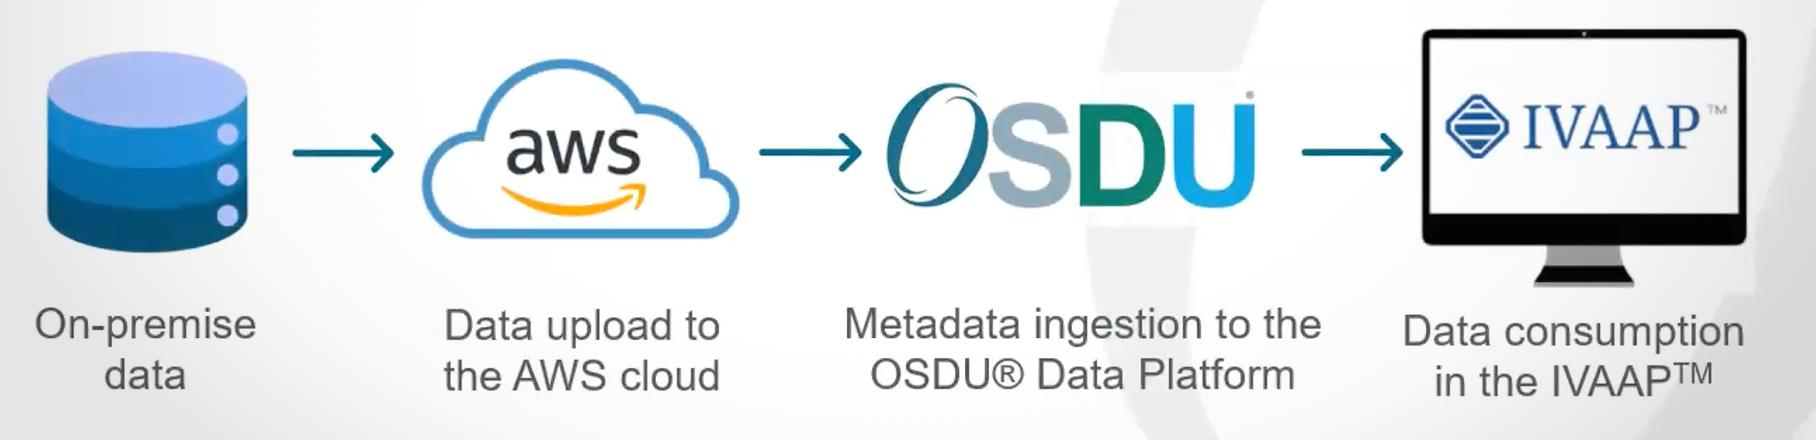
- Cloud Compatibility: OpenZGY and OpenVDS pave the way for seamless cloud integration. Geospatial professionals can leverage scalable cloud storage and processing for large-scale projects.
INT’s Commitment to Open Data Standards
At INT, we are strong advocates of open data standards in the geoscience realm. Our work with and early adoption of the OSDU Data Platform and our integration of OpenVDS and OpenZGY formats exemplify this dedication. Here’s how this benefits our users:
- Streamlined Workflows: With the superior performance of OpenVDS and OpenZGY, INT users experience accelerated interpretation cycles. Complex analyses and visualization become significantly faster.
- Data Interoperability: Projects involving various software tools become more effortless. Data can move freely between INT and other OSDU-compliant applications.
- Future-Proofing: As the industry continues to embrace OSDU, INT ensures our users are well-positioned to take advantage of the evolving data landscape.
Leveraging INT with OpenZGY and OpenVDS
INT’s powerful visualization platform — IVAAP — offers numerous use cases for datasets stored in OpenVDS and OpenZGY formats:
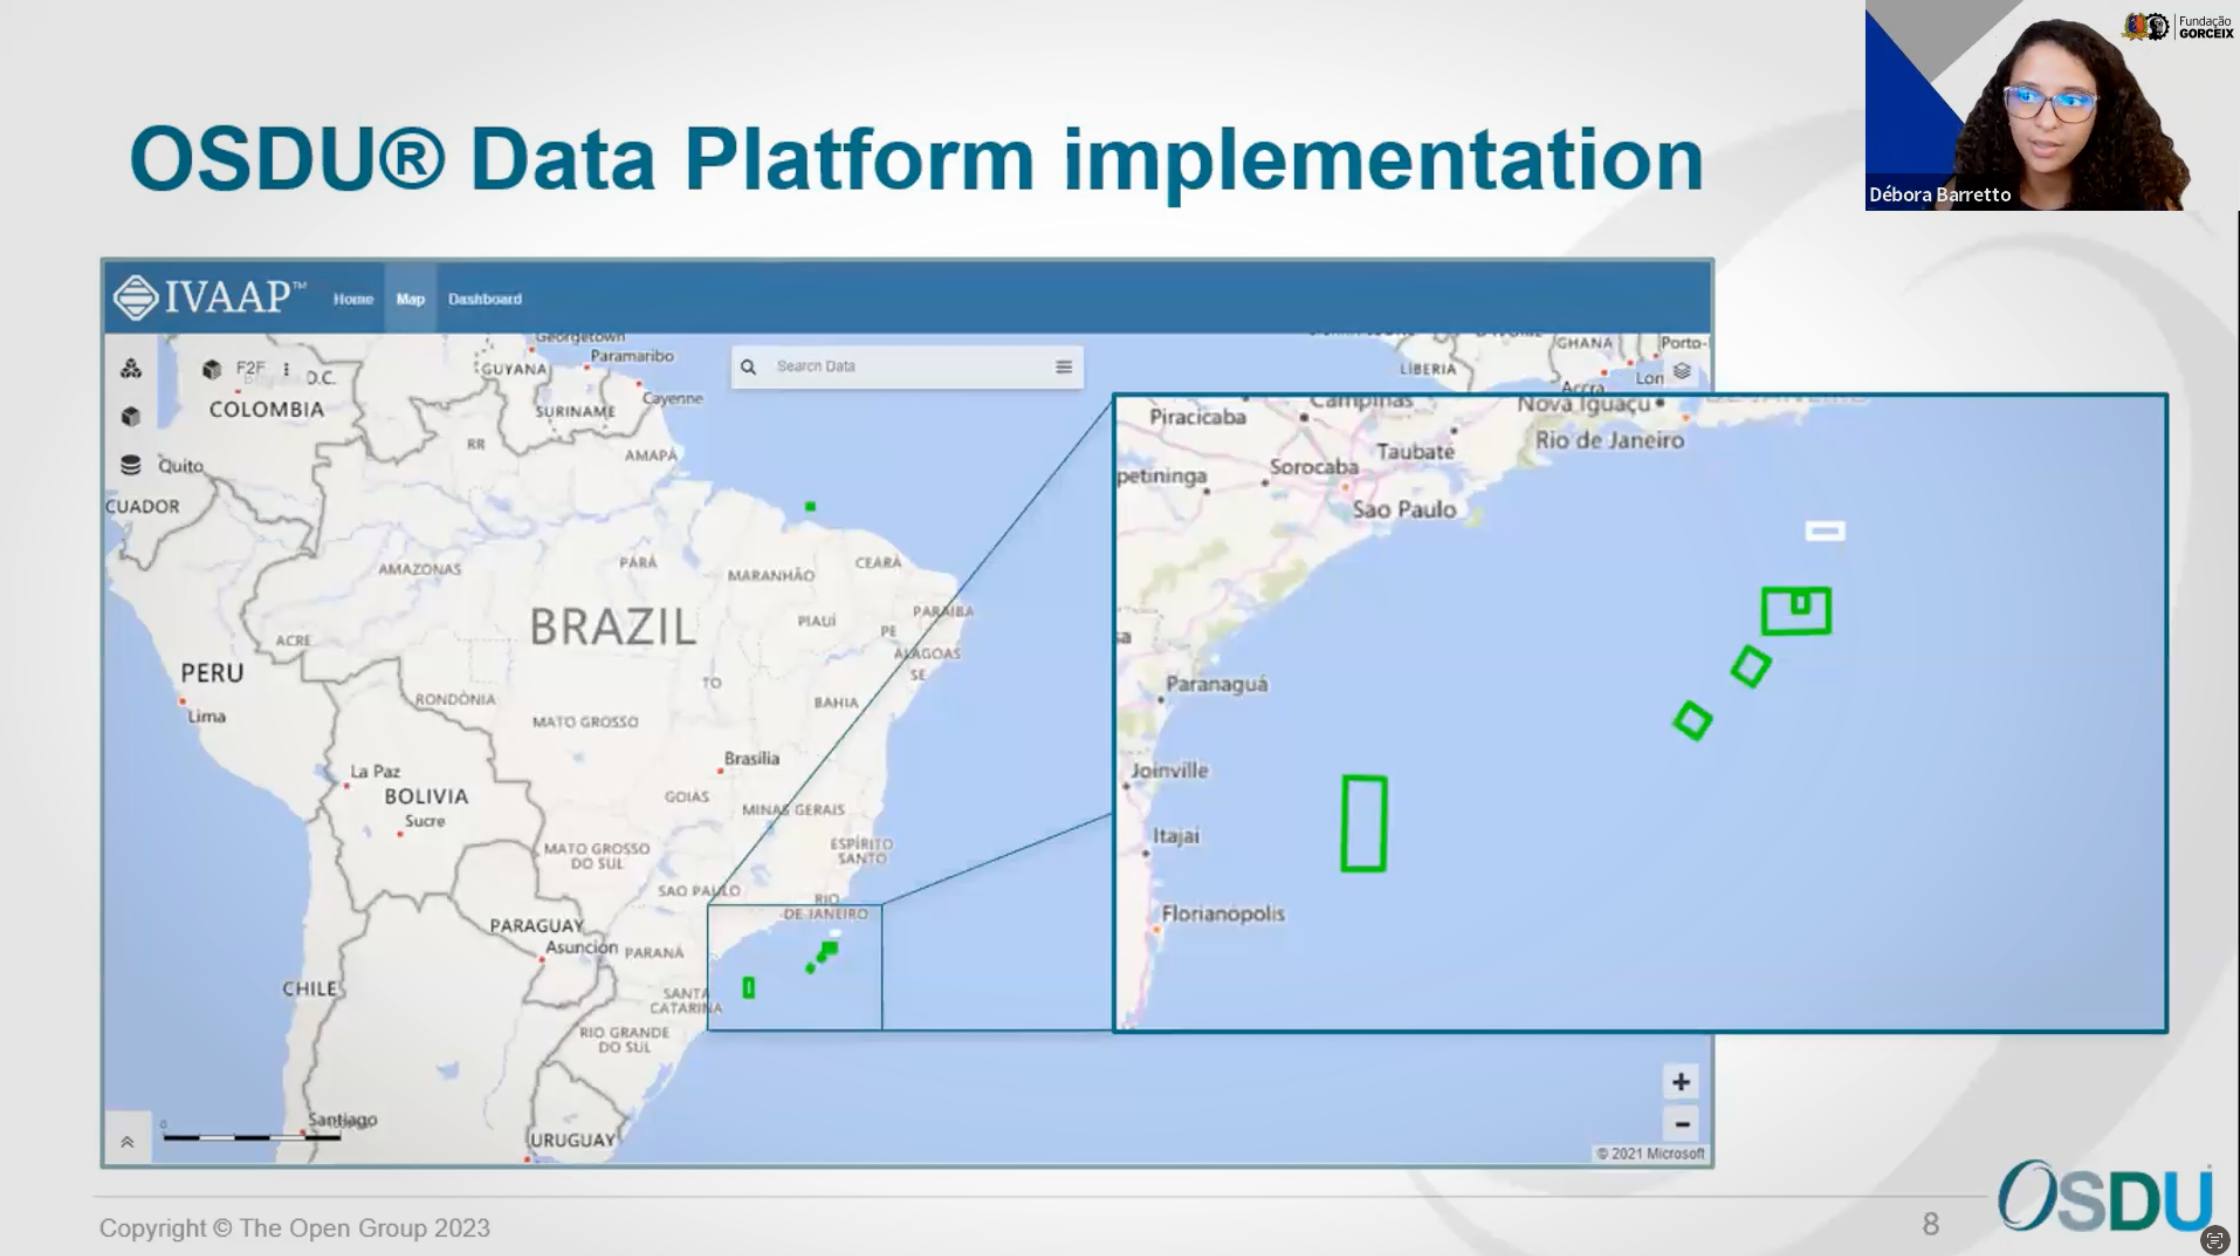
- Rapid Survey Evaluation: Quickly visualize and assess seismic surveys for quality control and planning purposes.
- Efficient Attribute Generation: Accelerate attribute calculation and analysis on these optimized data structures.
- Collaborative Interpretation Workflows: Share insights and seamlessly merge interpretations from location-dispersed team members working with OSDU-compliant data.
The Road Ahead
INT is actively engaged in the ongoing development of the OSDU platform. We’re dedicated to extending our support for OpenZGY and OpenVDS and other emerging data formats within the OSDU ecosystem. By continuing to optimize our platform for cutting-edge data standards, we strive to provide our users with industry-leading tools for unlocking valuable insights.
If you’re ready to propel your geospatial workflows with the power of OpenZGY, OpenVDS, and INT, don’t hesitate to contact us. Explore how our tailored solutions and commitment to open data can transform your subsurface visualization.