

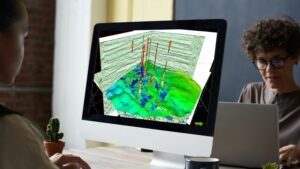
Data-Driven Energy: Overcoming Challenges, Unlocking Insights with Advanced Visualization
Data science and advanced visualization are not just trends; they are essential tools for energy companies seeking to thrive in a competitive landscape. By overcoming challenges and embracing these technologies, the industry can unlock new efficiencies, improve safety, and drive profitability.

Mastering Advanced CRS Conversions with Apache SIS
In this technical guide, we’ll dive into how to leverage Apache SIS to perform advanced CRS conversion with explicit control over each step. We’ll cover the four primary conversion steps, explore when to use each, and provide code samples to walk you through the process.
Celebrating a Decade of Innovation: GeoToolkit.JS Marks 10 Years of Empowering Subsurface Data Visualization
In the realm of subsurface data visualization, the 10th anniversary of GeoToolkit.JS marks a significant milestone. What began as a comprehensive set of high-performance tools […]
INT Supports OpenZGY and OpenVDS to Enhance Workflows and Data Collaboration
At INT, we are strong advocates of open data standards in the geoscience realm. Our work with and early adoption of the OSDU Data Platform and our integration of OpenVDS and OpenZGY formats exemplify this dedication.