GeoToolkit.JS 2024 introduces a significant upgrade to well log visualization, enhanced 3D capabilities, and expanded charting functionalities, along with numerous other enhancements, empowering developers to create more powerful and intuitive subsurface data visualization applications. Included with this release, INT is also launching a new Online GeoToolkit Documentation, providing comprehensive resources and support for developers.
Houston, TX — July 24, 2024 —INT, the leading provider of geoscience visualization software for the energy industry, announces the release of GeoToolkit.JS 2024, a significant update to its powerful JavaScript/TypeScript toolkit for building advanced subsurface applications. This release brings significant advancements across multiple areas, including well log visualization, 3D capabilities, charting functionalities, online documentation, and other key areas, empowering developers to create even more interactive visualizations.
“GeoToolkit.JS 2024 is a testament to INT’s commitment to continuous innovation and providing our customers with the most advanced tools for subsurface visualization,” said Dmitriy Lukyanenko, Director of Software Development at INT. “This release incorporates valuable feedback from our users, delivering a wide range of new features and improvements that enhance productivity, streamline workflows, and unlock new possibilities for data exploration and analysis.”
Top 4 Highlights of GeoToolkit.JS 2024:
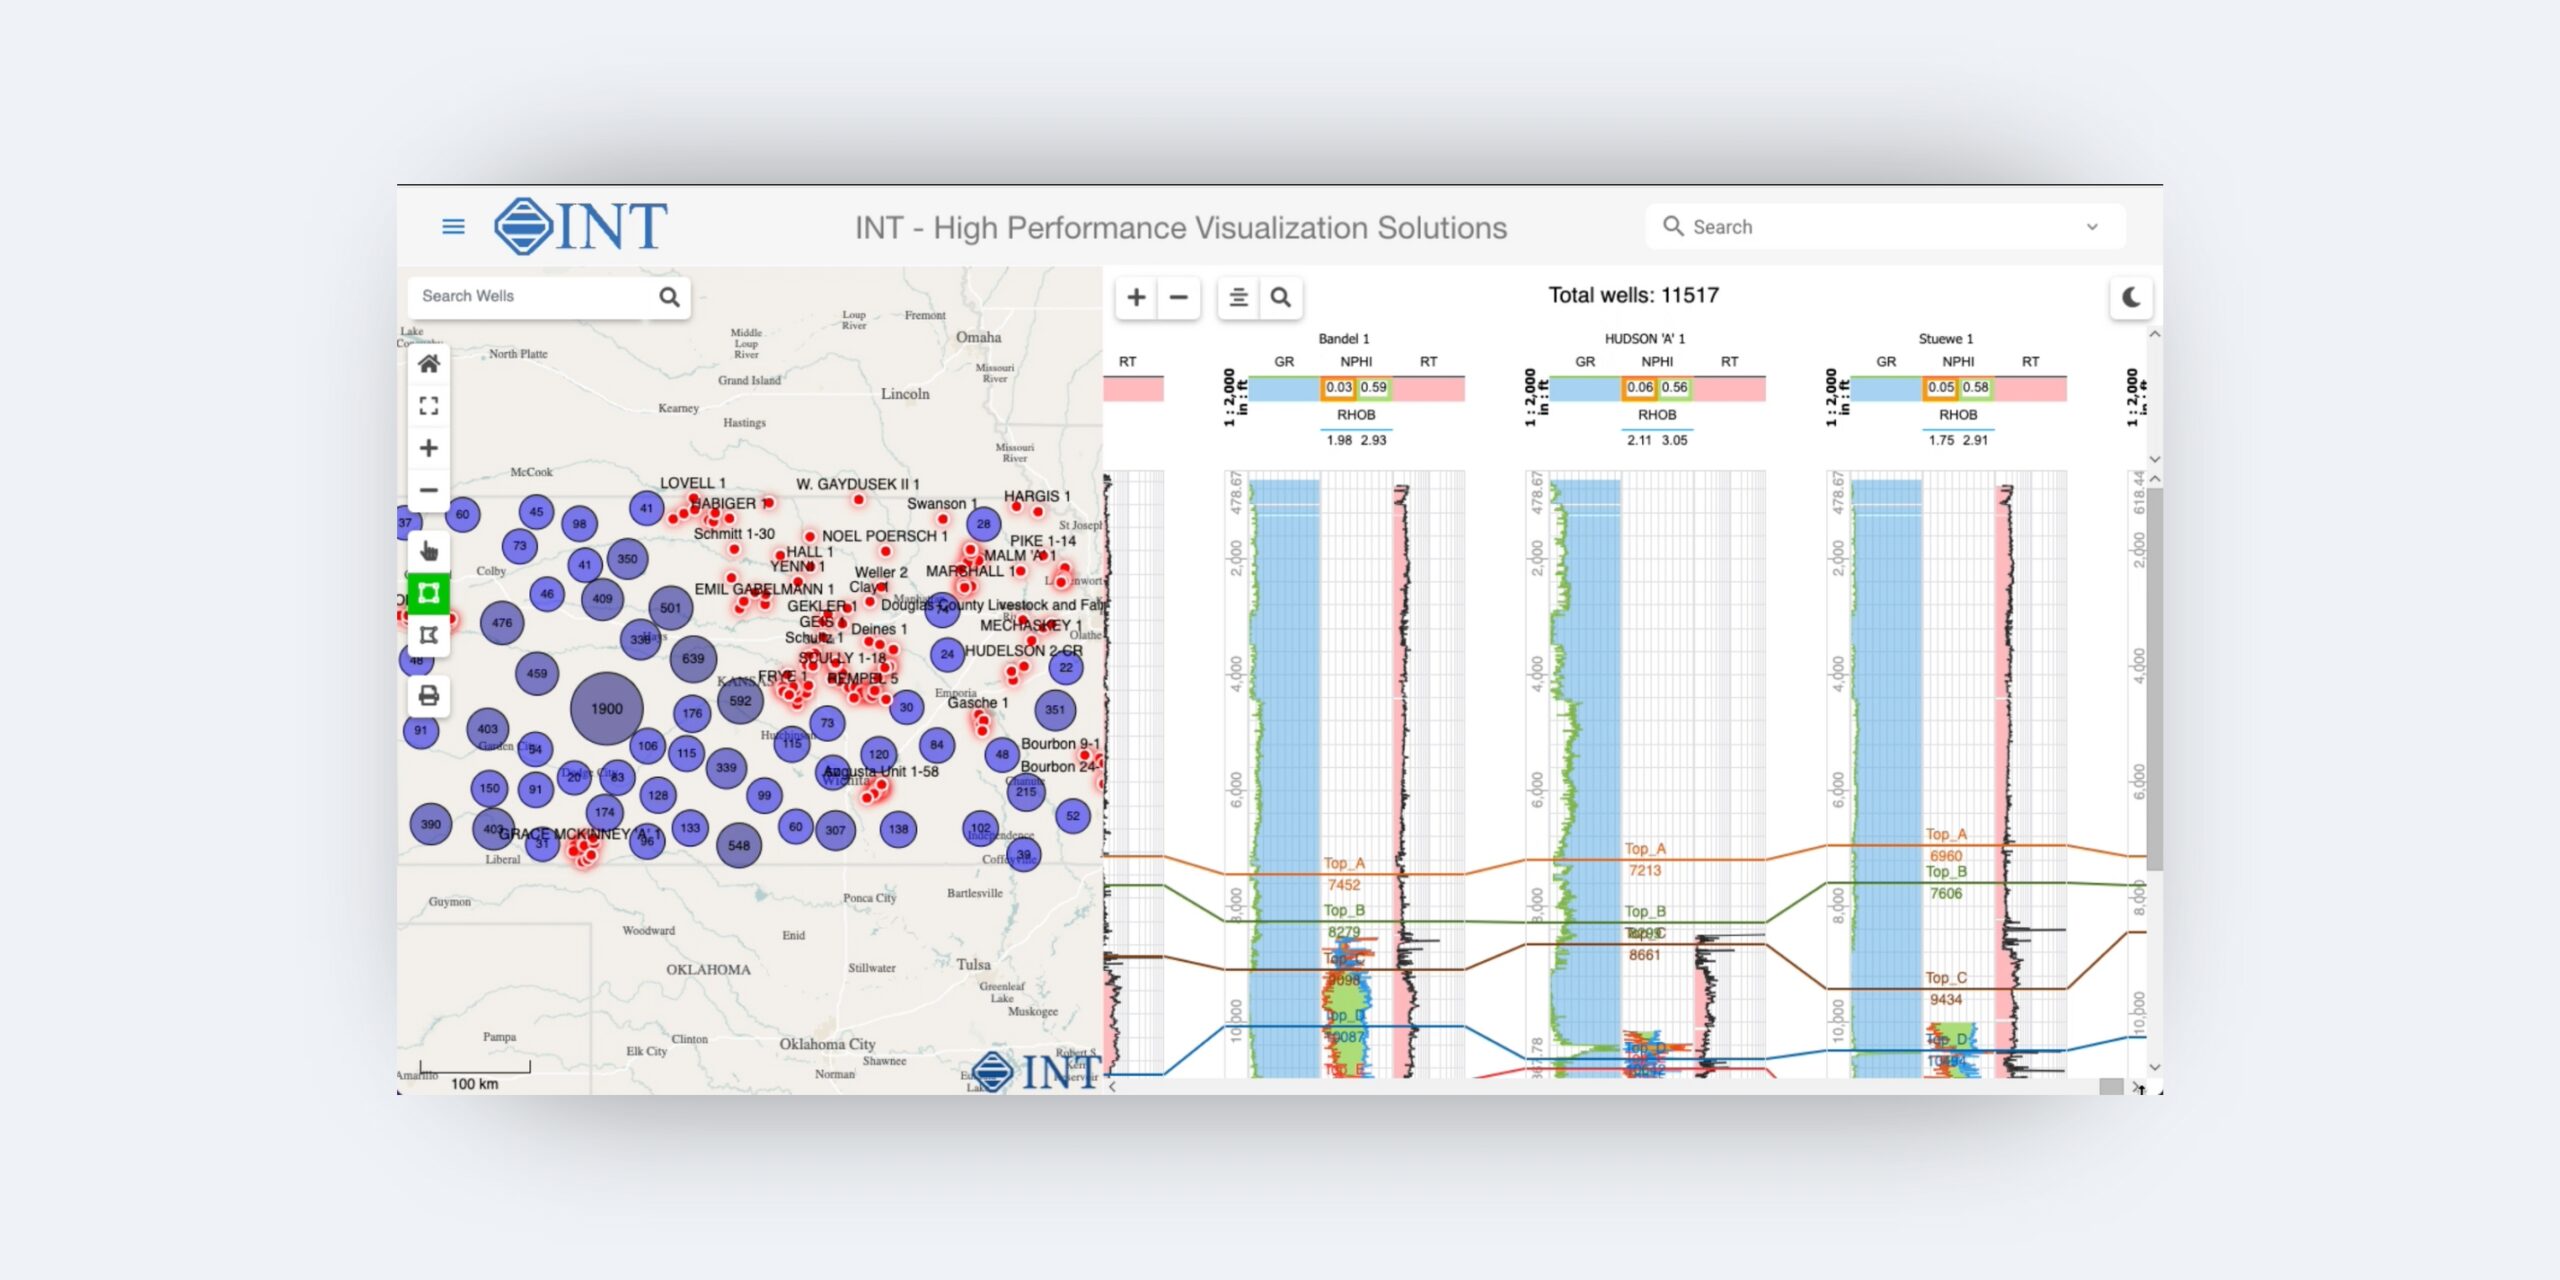
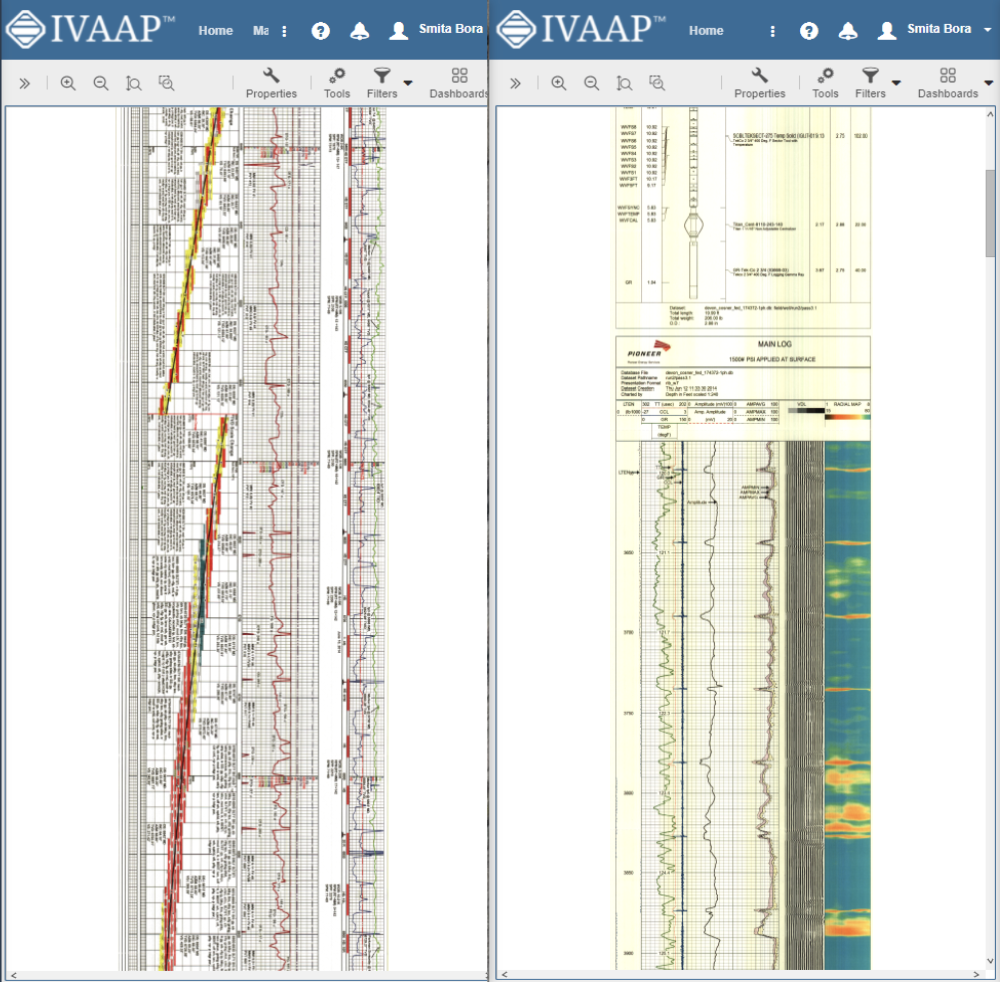
- Enhanced Well Log Visualization: Enhanced well log visualization and analysis capabilities, including support for attached headers and footers, default tooltips, proportional distance mode for correlation display, multiple zones for AdaptiveLogHeader, LAS 3.0 writer, and more. These new features offer developers greater flexibility and customization options when presenting well log data to users.
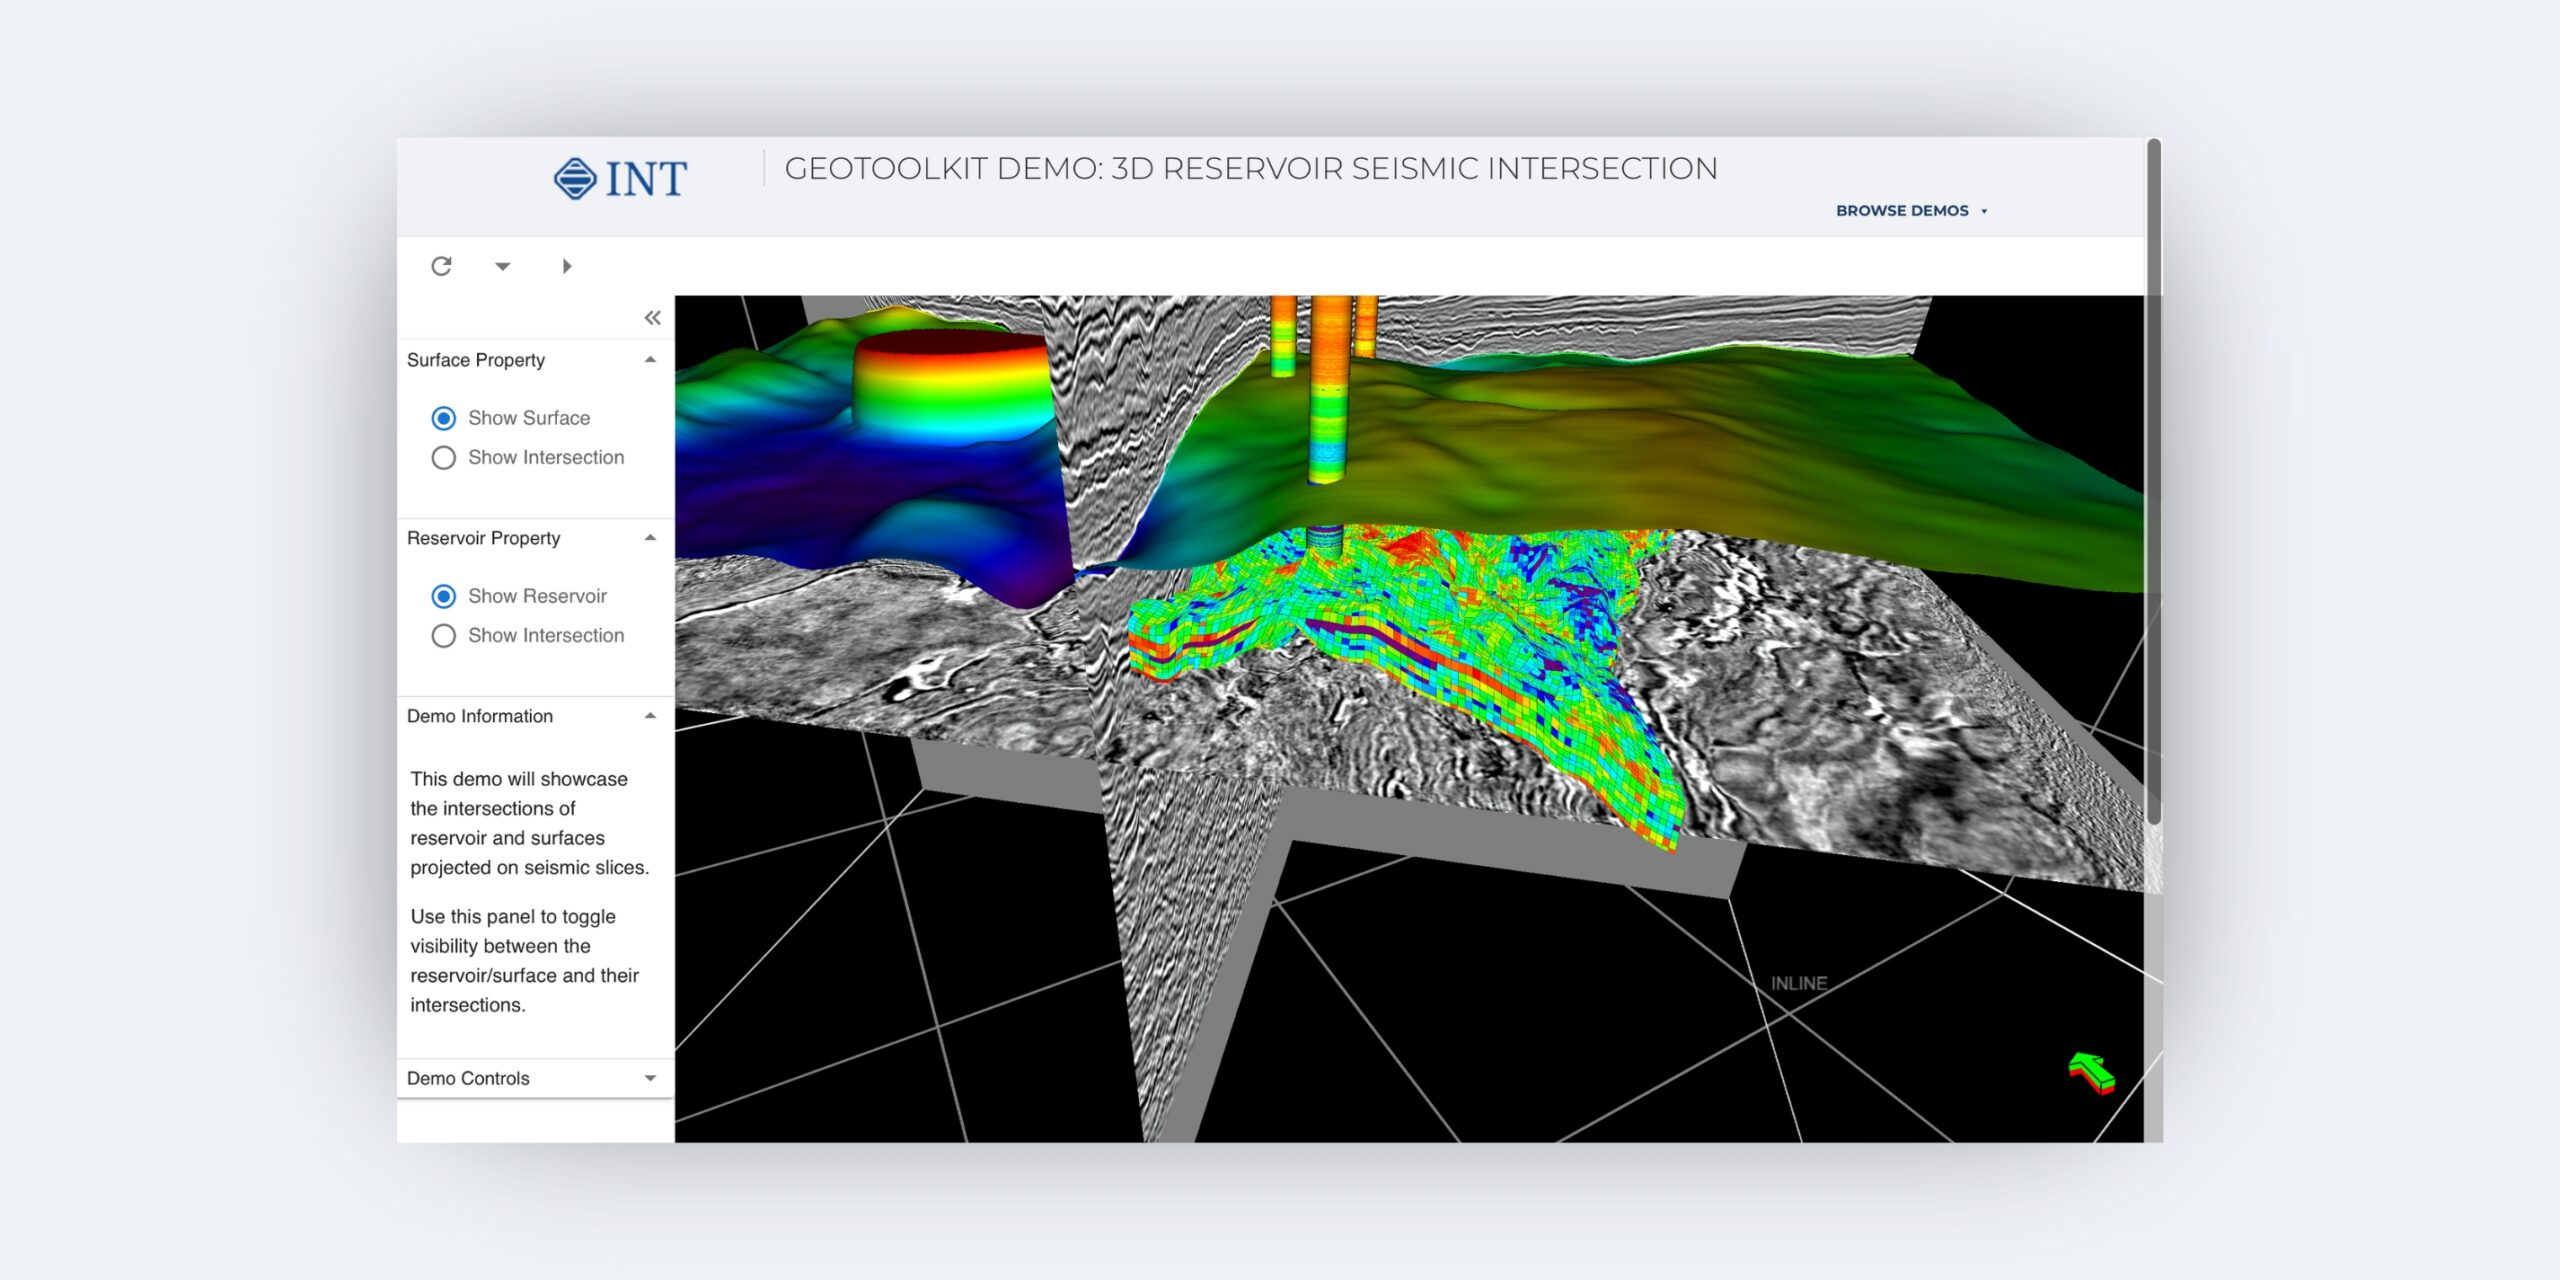
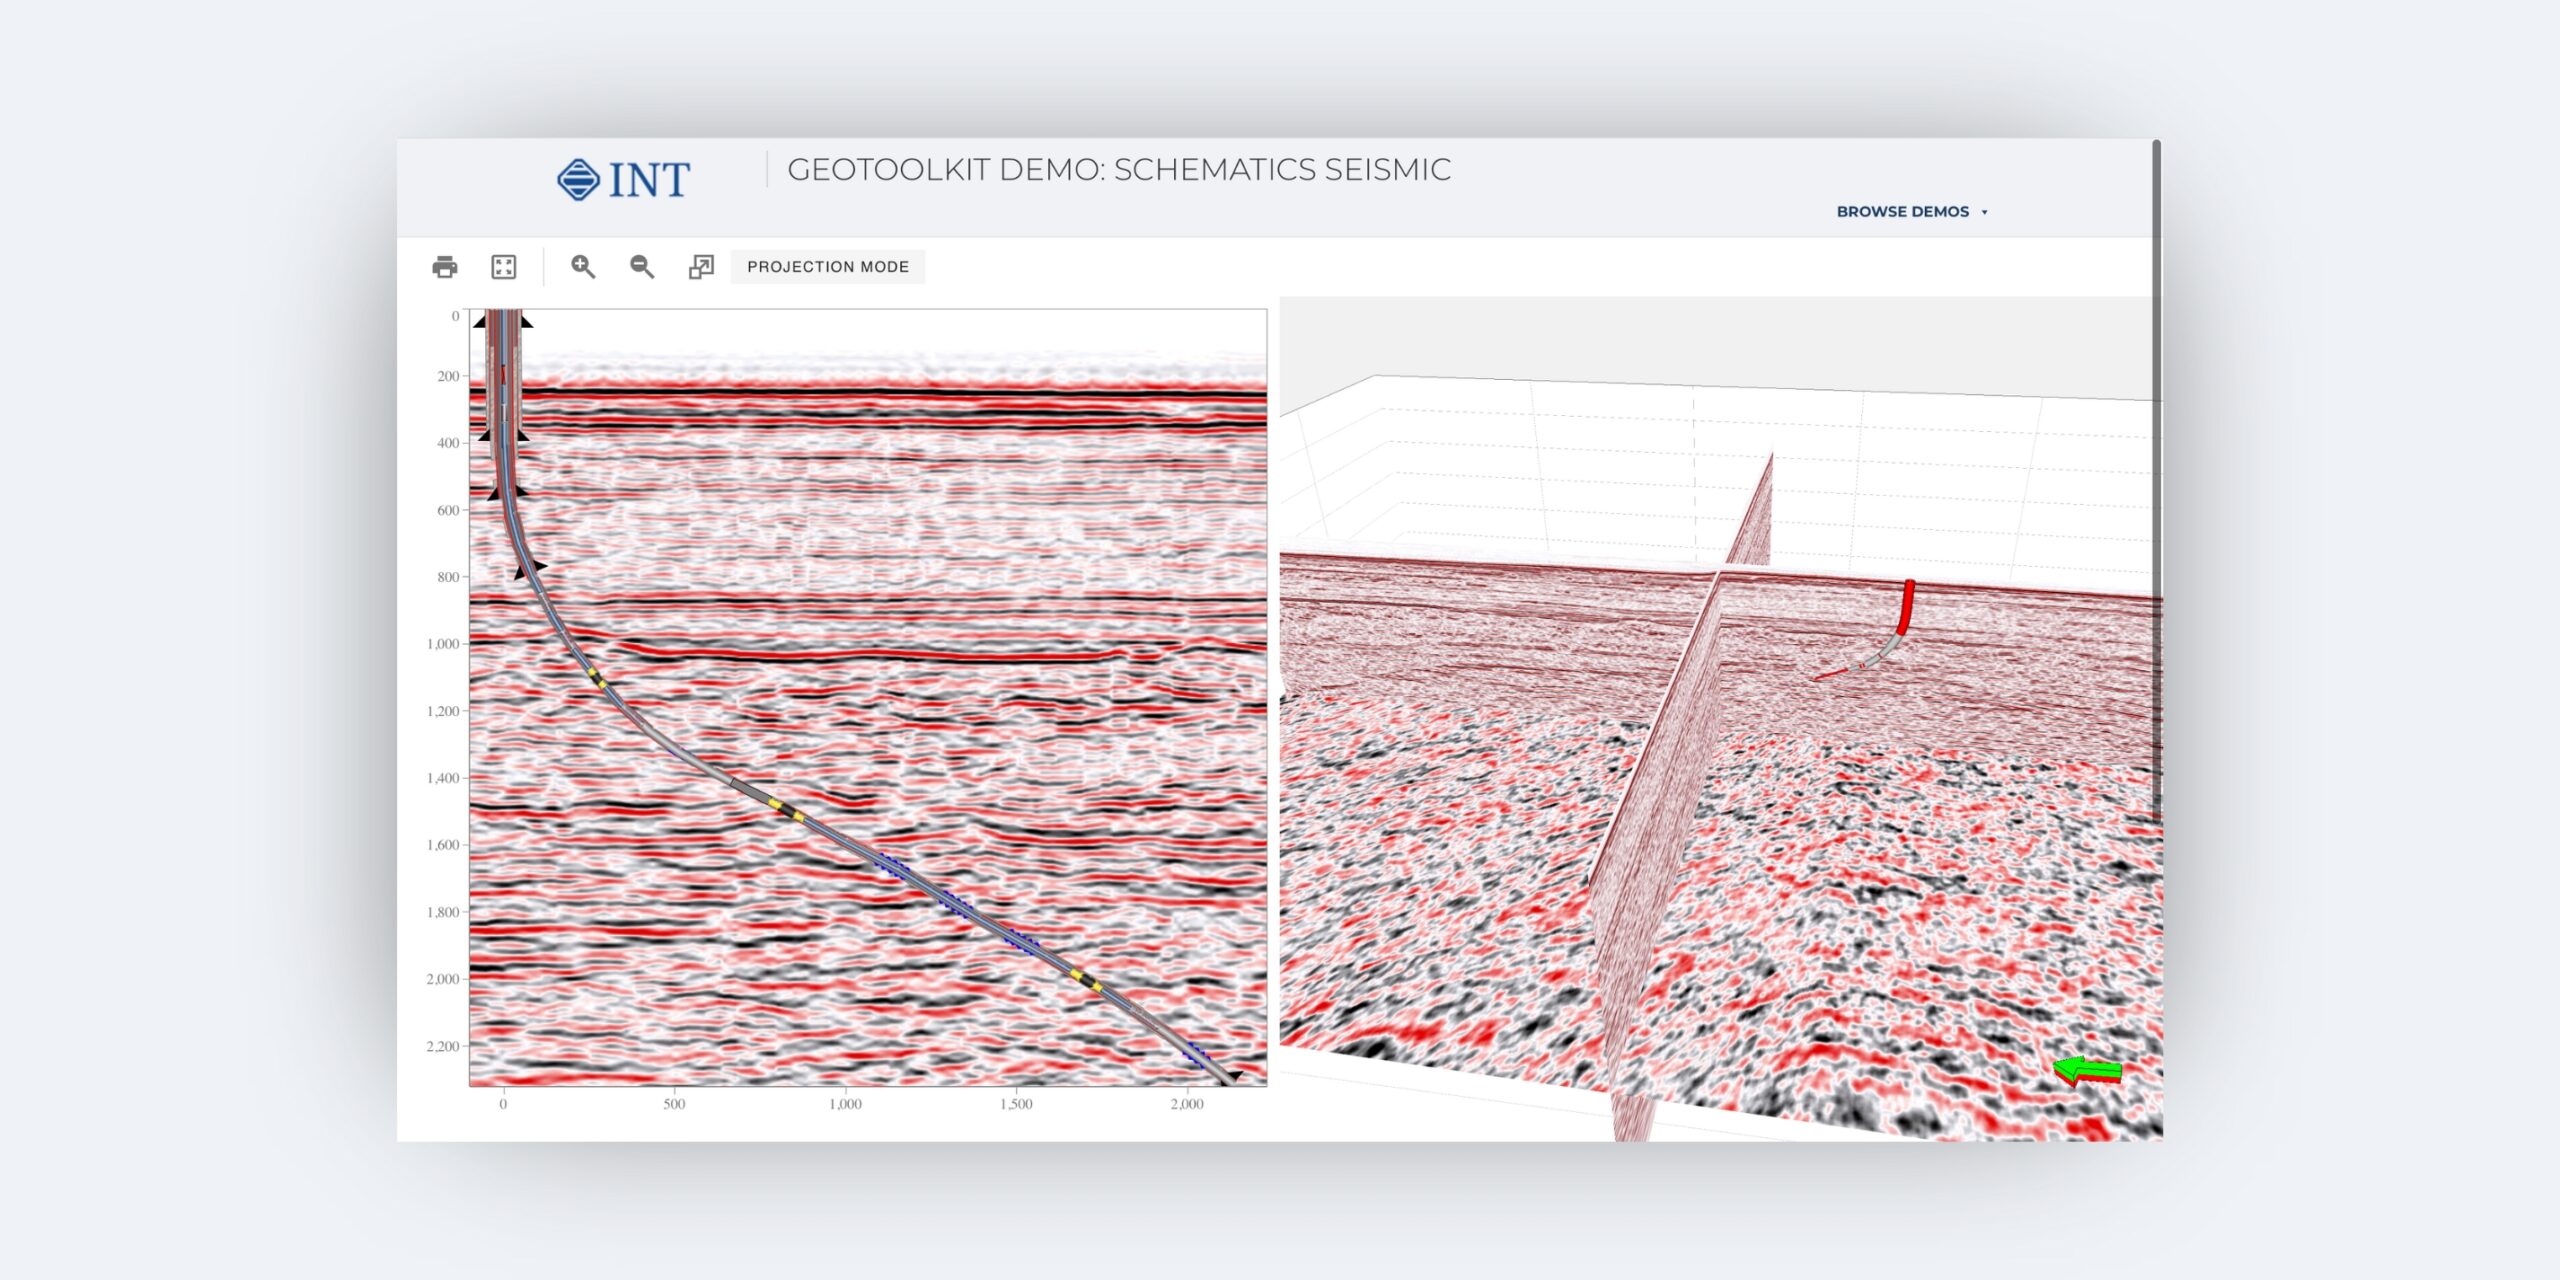
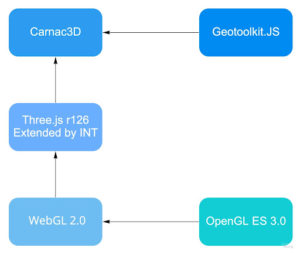
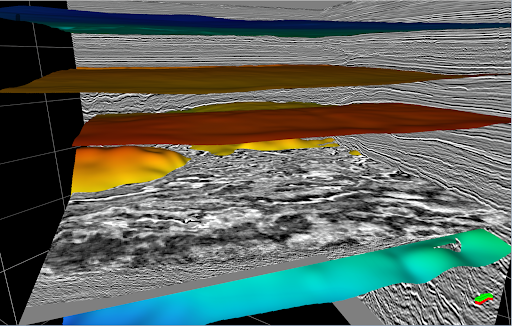
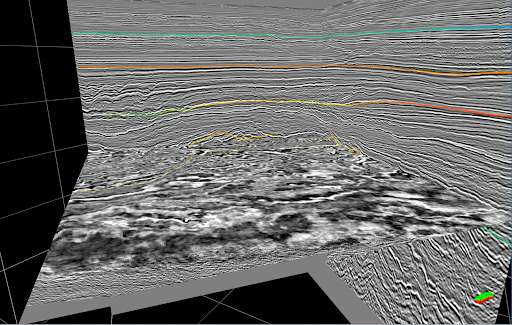
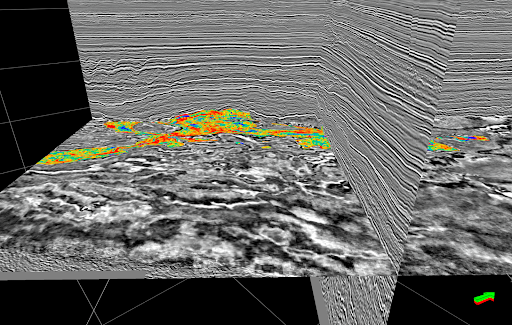
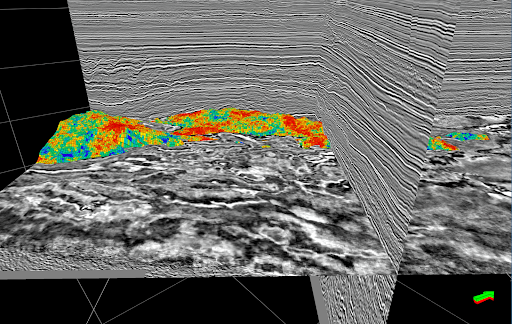
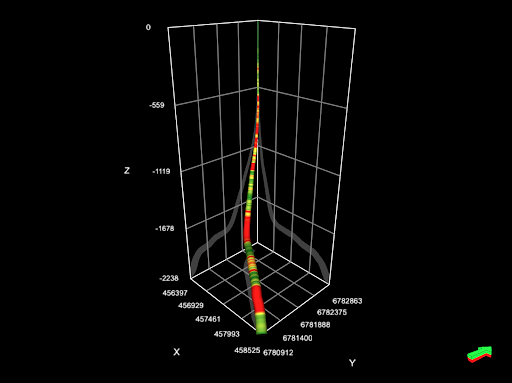
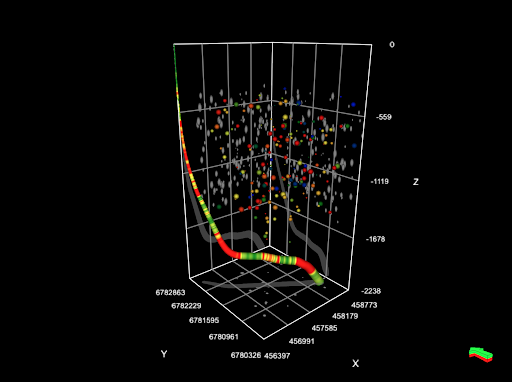
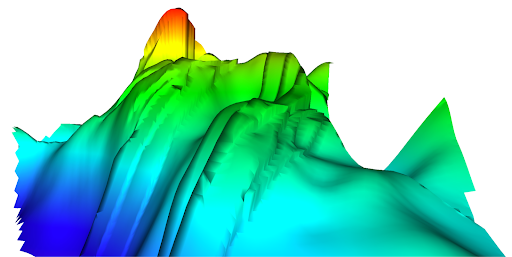
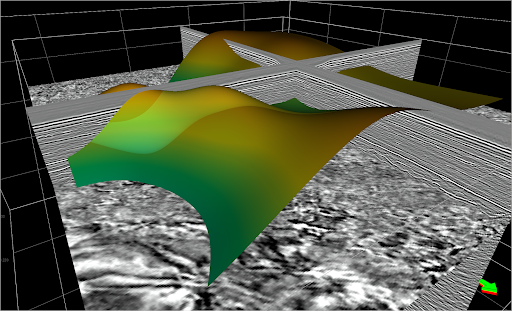
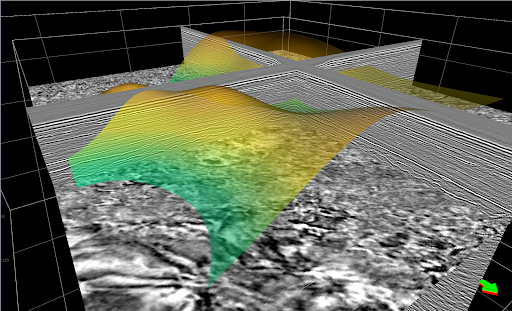
- Expanded 3D Capabilities: Advanced 3D reservoir visualization along well trajectories, faster and more memory-efficient 3D volume rendering, and new features like HighlightMode for PointSet, WellLog Array 2D, and horizontal anchor option for 3D labels. Developers can leverage these capabilities to create immersive 3D visualizations that facilitate a better understanding of subsurface structures.
- Advanced Charting:New polar and ternary chart systems with LineChart, AreaChart, and CrossPlot options, logic to swap axes, support for reference lines as shapes in Time Series Widget, and enhanced regression lines with labels. These enhancements offer developers a broader range of chart types and customization options, enabling them to create more informative and visually appealing data displays.
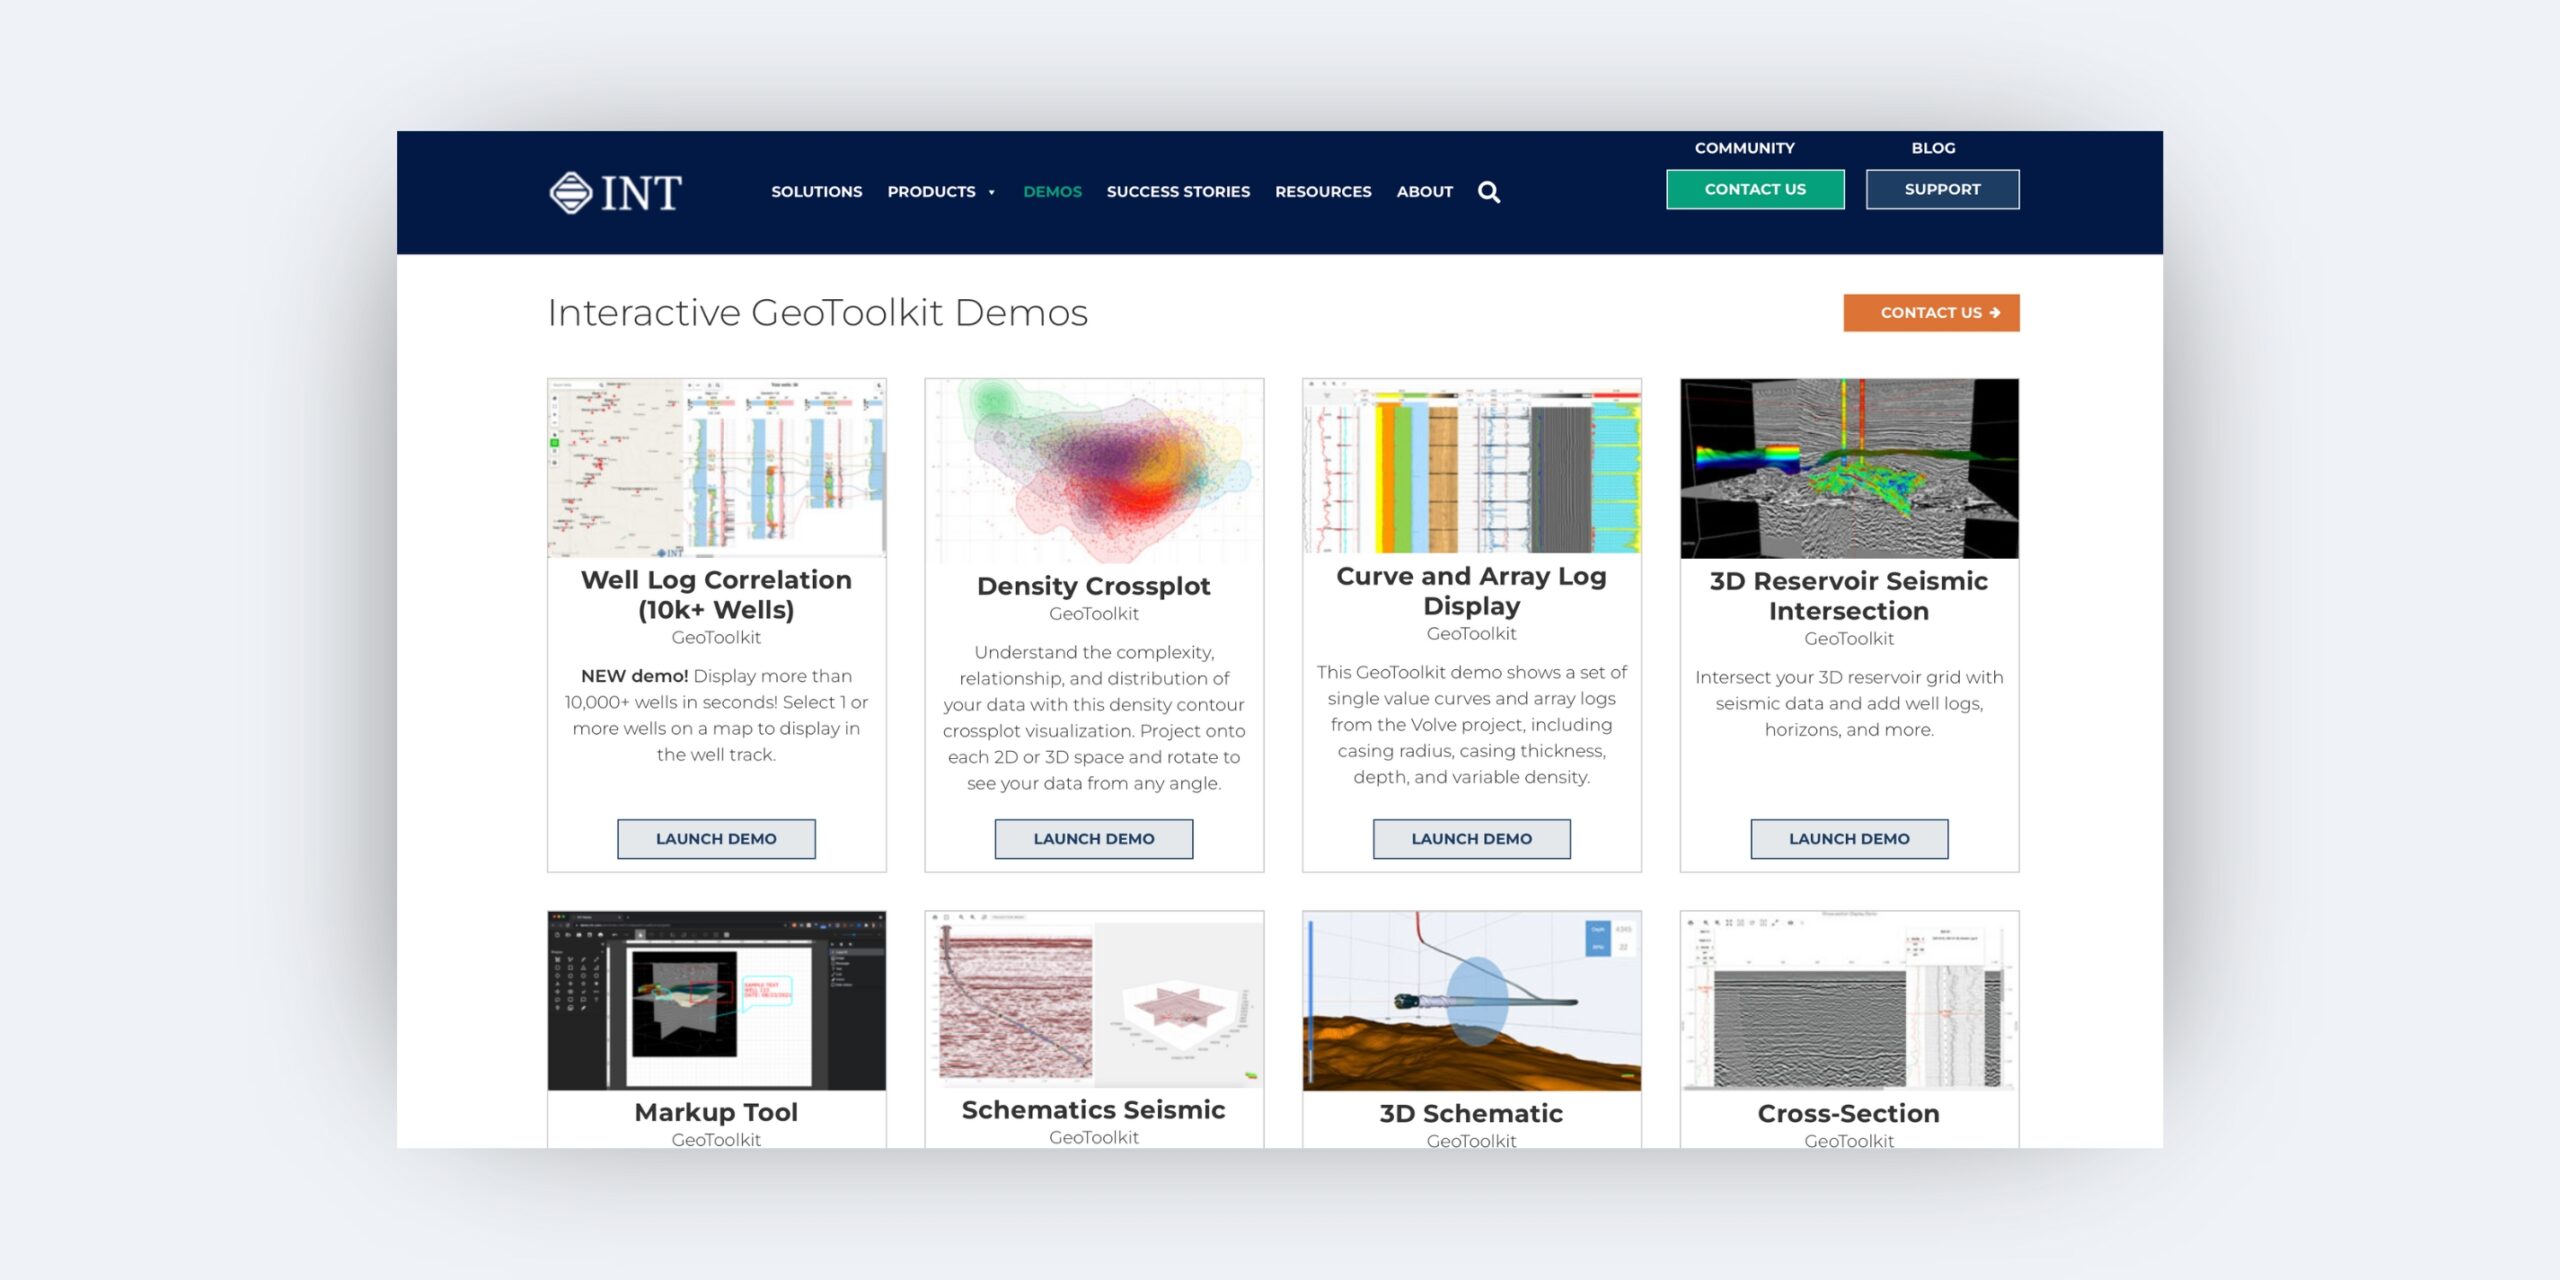
- New Online Documentation:Enhancing the developer experience, INT is launching a comprehensive Online GeoToolkit Documentation with GeoToolkit.JS 2024. This interactive platform offers a wealth of resources, including interactive demos, step-by-step tutorials, and a live Code Sandbox for experimenting with GeoToolkit widgets. The new documentation empowers developers to quickly get started, master GeoToolkit’s functionalities, and build cutting-edge visualization applications with ease.
Other Notable Improvements:
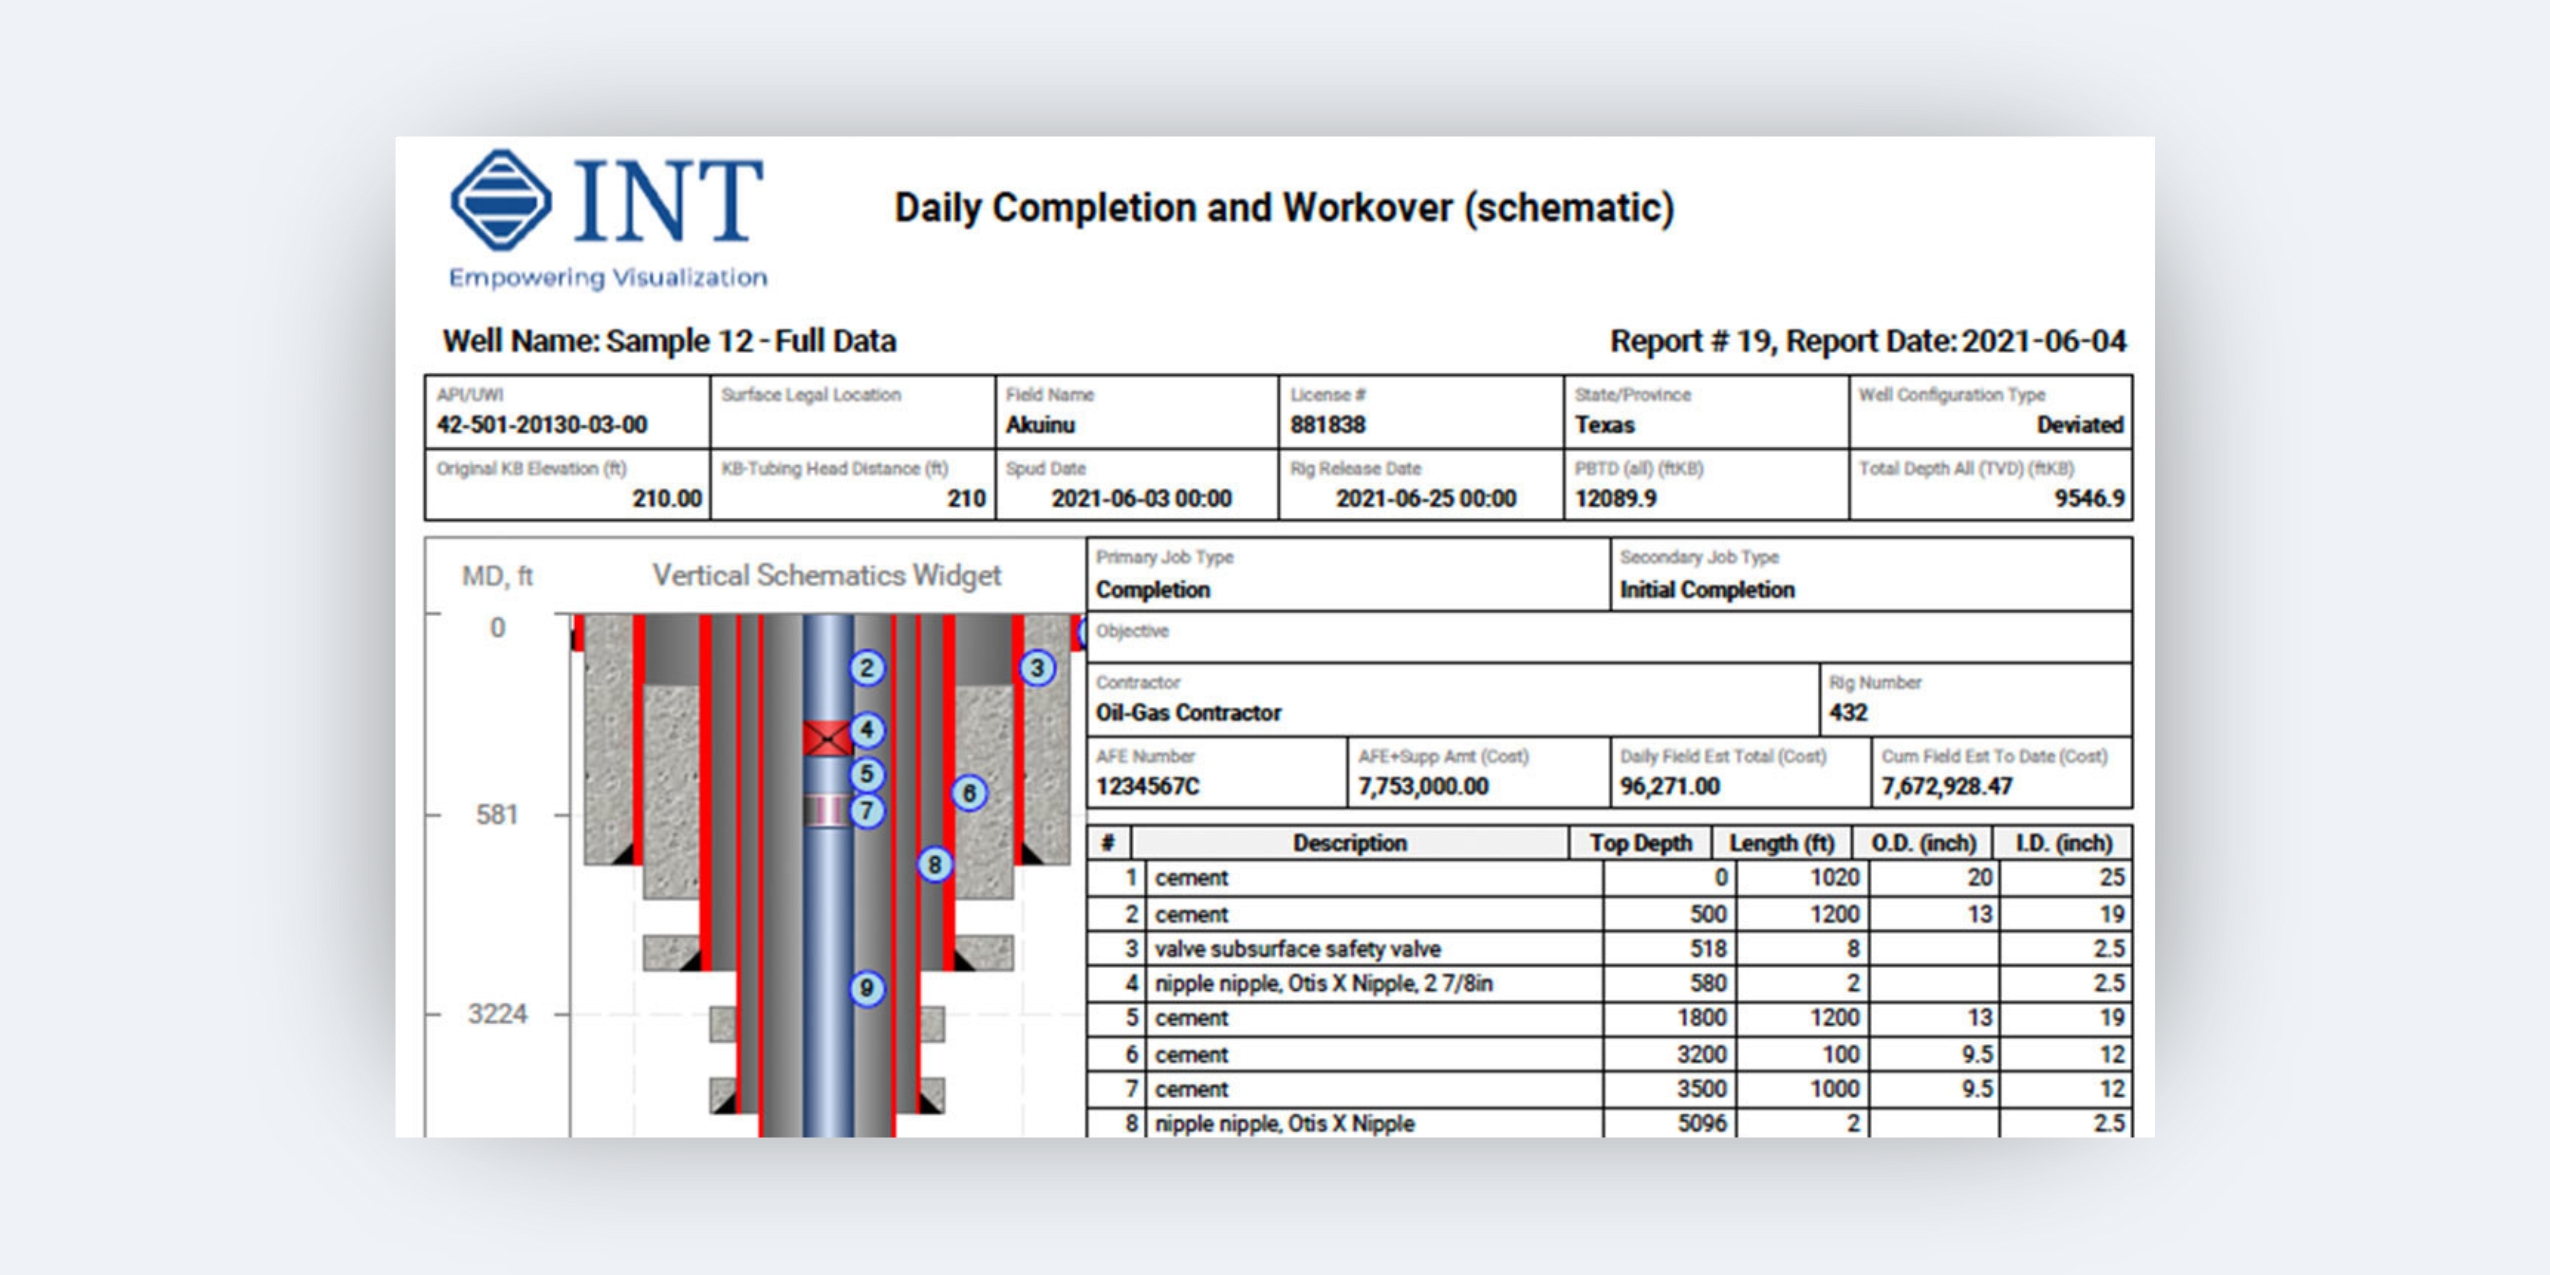
In addition to the top highlights, GeoToolkit.JS 2024 includes numerous other improvements across schematics, seismic, demos and tutorials, and map functionalities. These enhancements further solidify GeoToolkit.JS as the go-to toolkit for subsurface data visualization.
For further information on the full list of features and enhancements in GeoToolkit.JS 2024, please visit www.int.com/geotoolkit.
Read the GeoToolkit.JS 2024 Release Notes.
Read the press release on PRWeb.
____________
ABOUT GEOTOOLKIT:
GeoToolkit™ is a comprehensive set of high-performance tools and libraries to display 2D/3D seismic, well log, schematics, contour, maps, charts, and more. Perfect for developers who want to build advanced domain-oriented software quickly.
ABOUT INT:
INT software empowers the largest energy and services companies in the world to visualize their complex subsurface data (seismic, well log, reservoir, and schematics in 2D/3D). INT offers a visualization platform (IVAAP) and libraries (GeoToolkit) developers can use with their data ecosystem to deliver subsurface solutions (Exploration, Drilling, Production). INT’s powerful HTML5/JavaScript technology can be used for data aggregation, API services, and high-performance visualization of G&G and petrophysical data in a browser. INT simplifies complex subsurface data visualization.
For more information about GeoToolkit or INT’s other data visualization products, please visit https://www.int.com.
INT, the INT logo, and GeoToolkit are trademarks of Interactive Network Technologies, Inc., in the United States and/or other countries.