IVAAP
NEW demo! This example of well cement and casing integrity uses sonic tool (DSLT) and ultrasonic tool (USIT) using data from the Volve Data Village dataset.
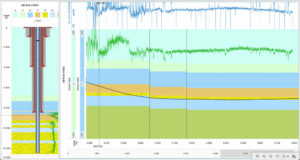
IVAAP
NEW demo! Easily combine horizontal well sections with vertical projection and schematics to help with geosteering and more.
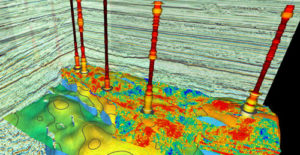
IVAAP
Aggregate data to combine 3D seismic, contour, reservoir, well log, and more in one dashboard.
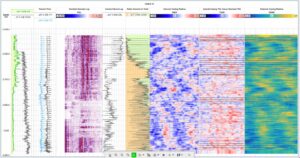
IVAAP
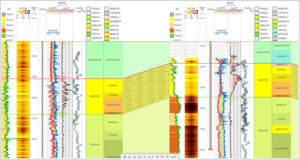
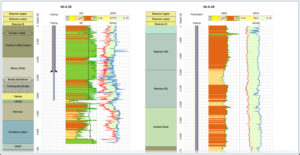
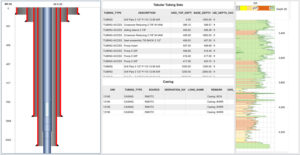
Combine into a single template: well log curves, formation dips, lithostratigraphy, facies and casing information, and markers.
IVAAP
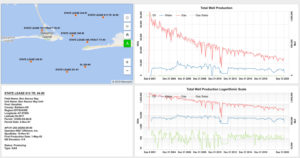
Monitor total well and total well logarithmic production with this IVAAP dashboard using the Alabama dataset.
IVAAP
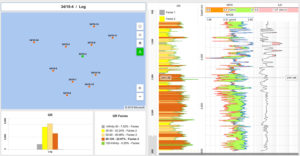
View map data, logs, charts, table data, and more in this dashboard using the North Sea dataset.
IVAAP
With IVAAP, you can combine all your data—casing, log, map, and more—in a single dashboard.
IVAAP
Using PPDM data, this dashboard combines schematics, table data, logs, and charts all in one view.
IVAAP
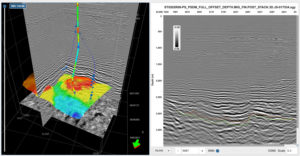
This IVAAP dashboard combines 3D seismic and well logs using the Volve dataset.
IVAAP
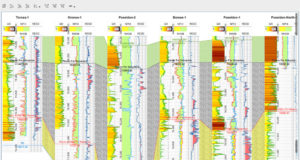
This well correlation dashboard combines well logs, 3D wells, and map views with table data using the Poseidon dataset.