INTViewer

Geoscience Analysis and QC, Simplified

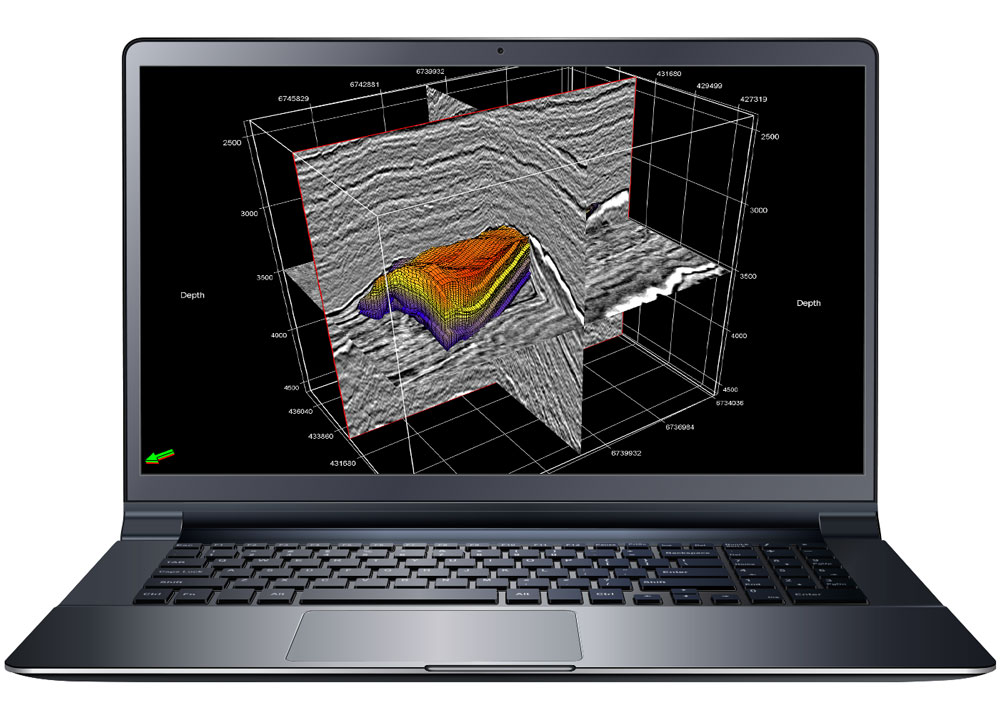
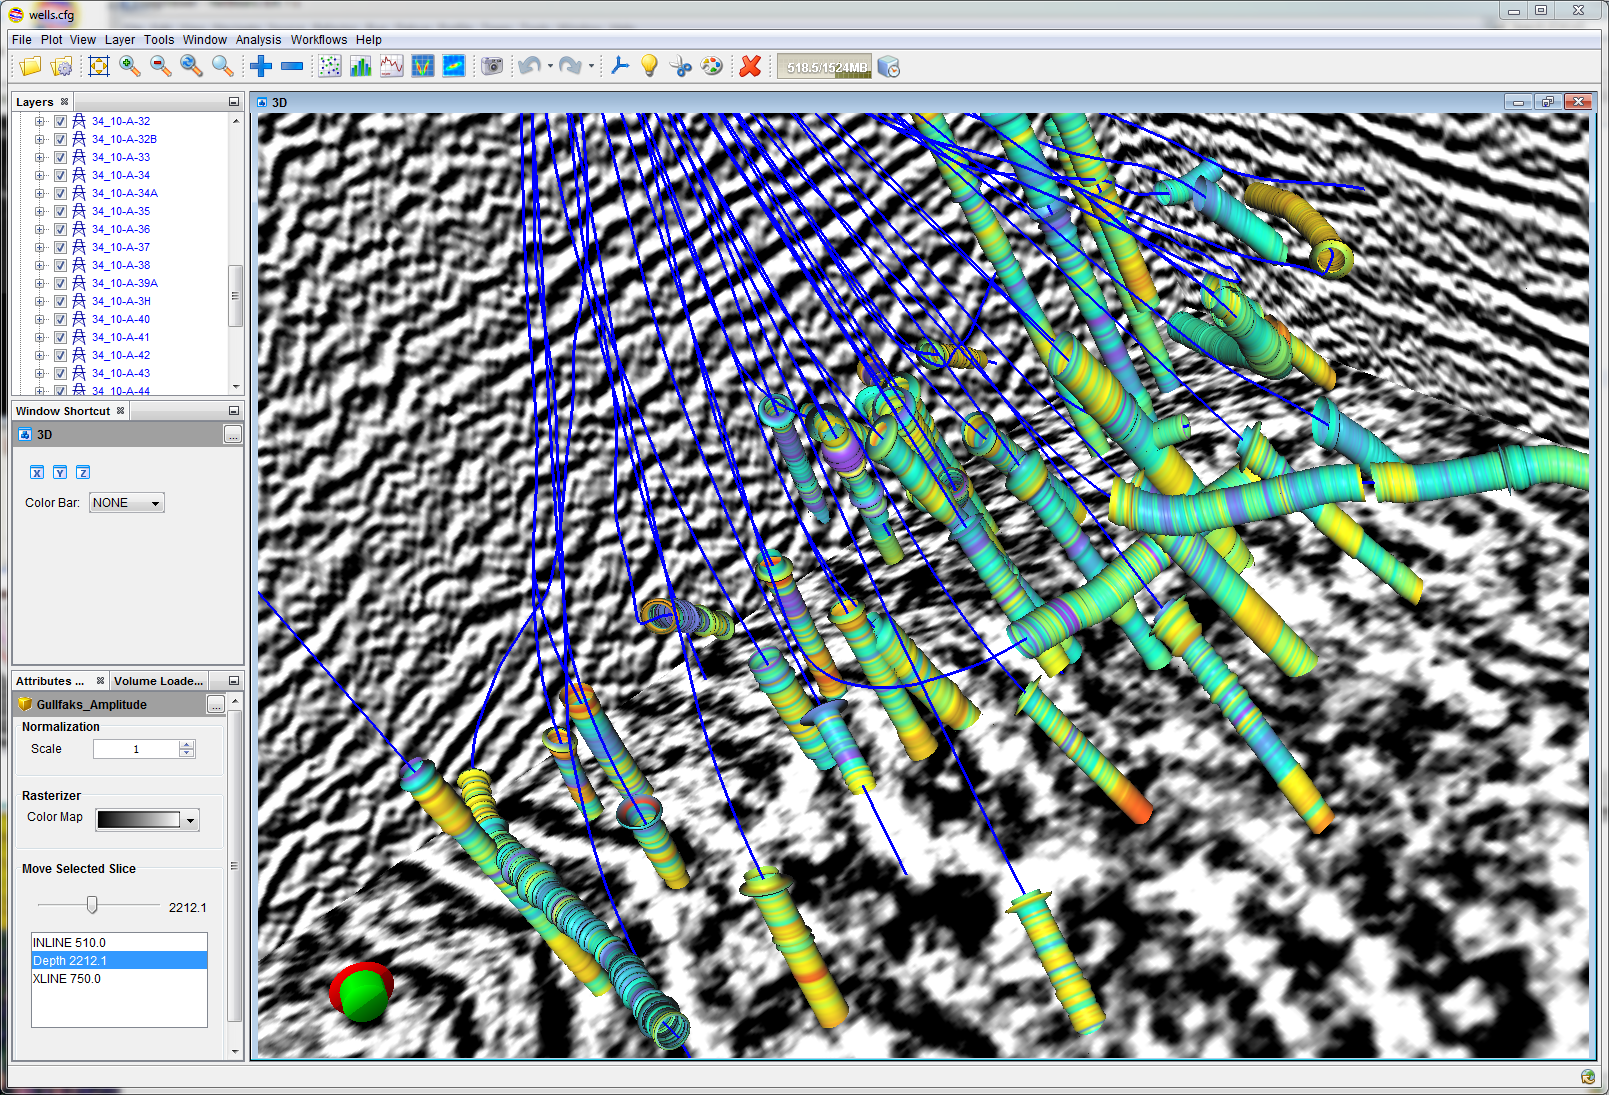
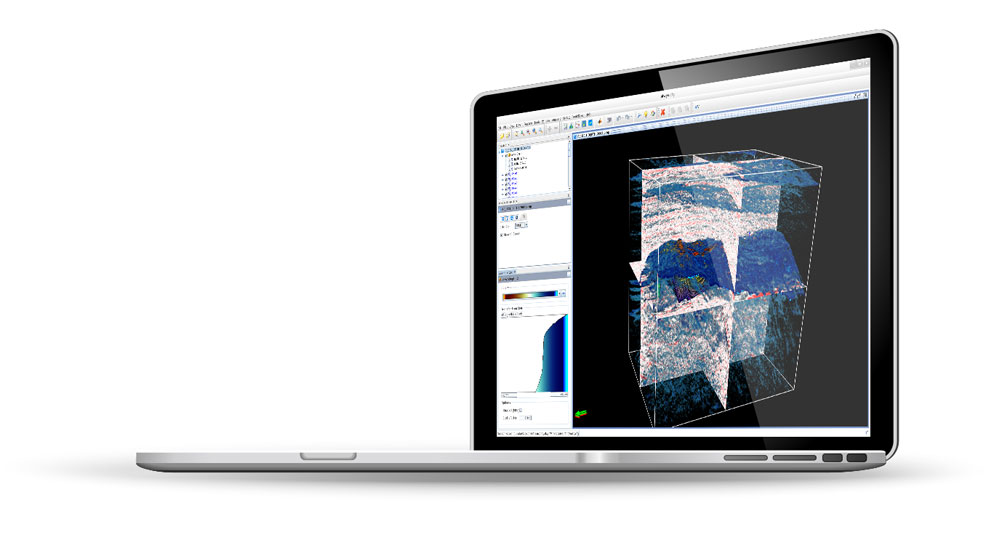
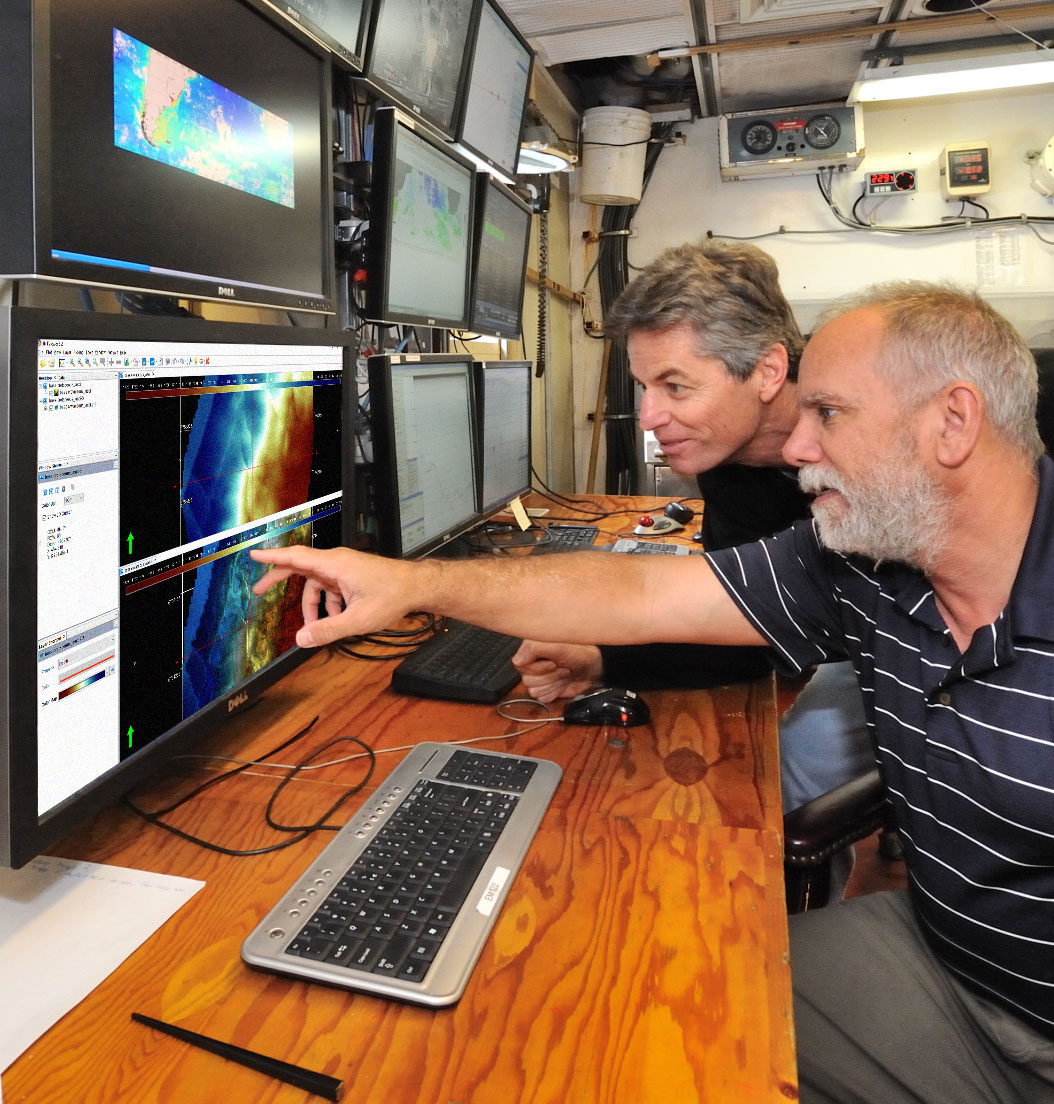
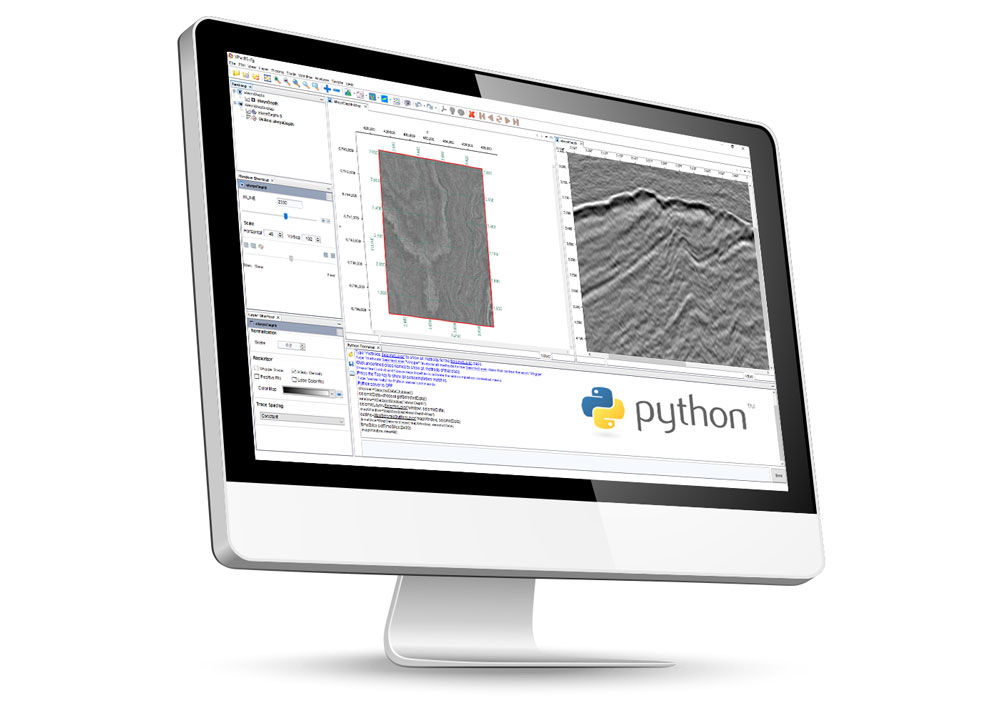
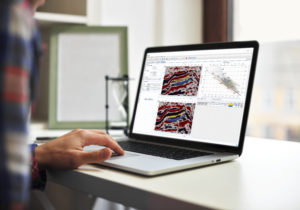
INTViewer is a platform and application that allows you to view your seismic data, check for errors, confirm geospatial integrity, perform light processing, and analyze your dataset. INTViewer is specifically designed to quickly access large datasets—prestack, stack, and 2D—from a laptop in the field to a desktop or remotely via the cloud. As a platform, INTViewer makes it easy to add or implement proprietary features on your own to meet the specific needs of your project, and with a simple Python script, you can automate your analysis. Or you can use INTViewer right out of the box as a complete application to work with your data instantly.

Download the Product Brochure

Be More Productive with Your Geoscience

Seismic Acquisition and Processing Quality Control From initial QC of a new seismic volume to more advanced QC, INTViewer offers the unique ability to work on prestack data.
headers-data
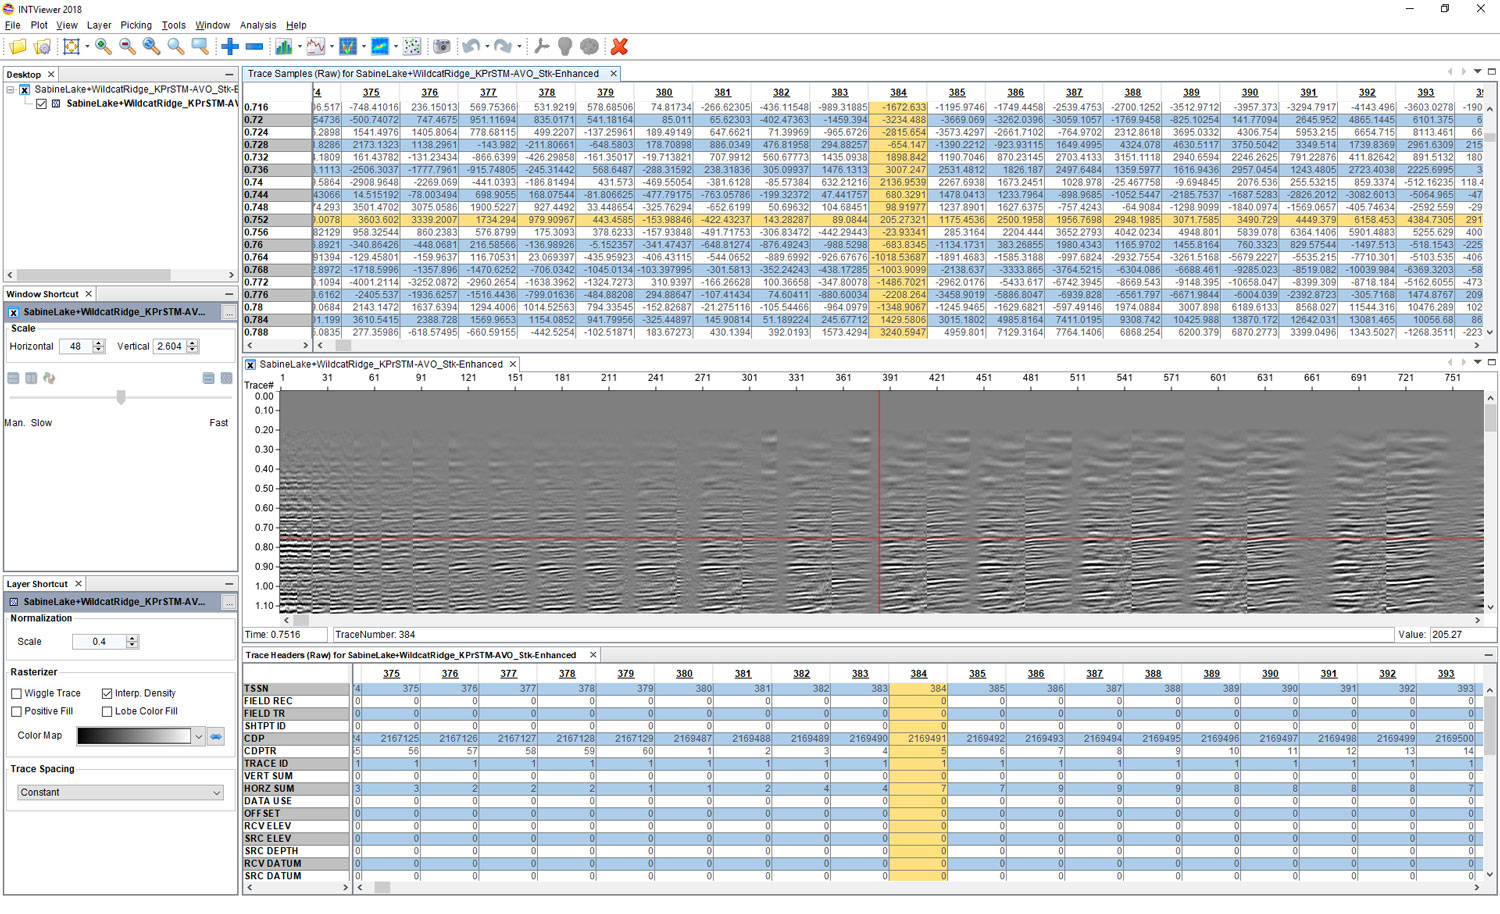
Inspect headers and sample values.
qc-seismic-frequency
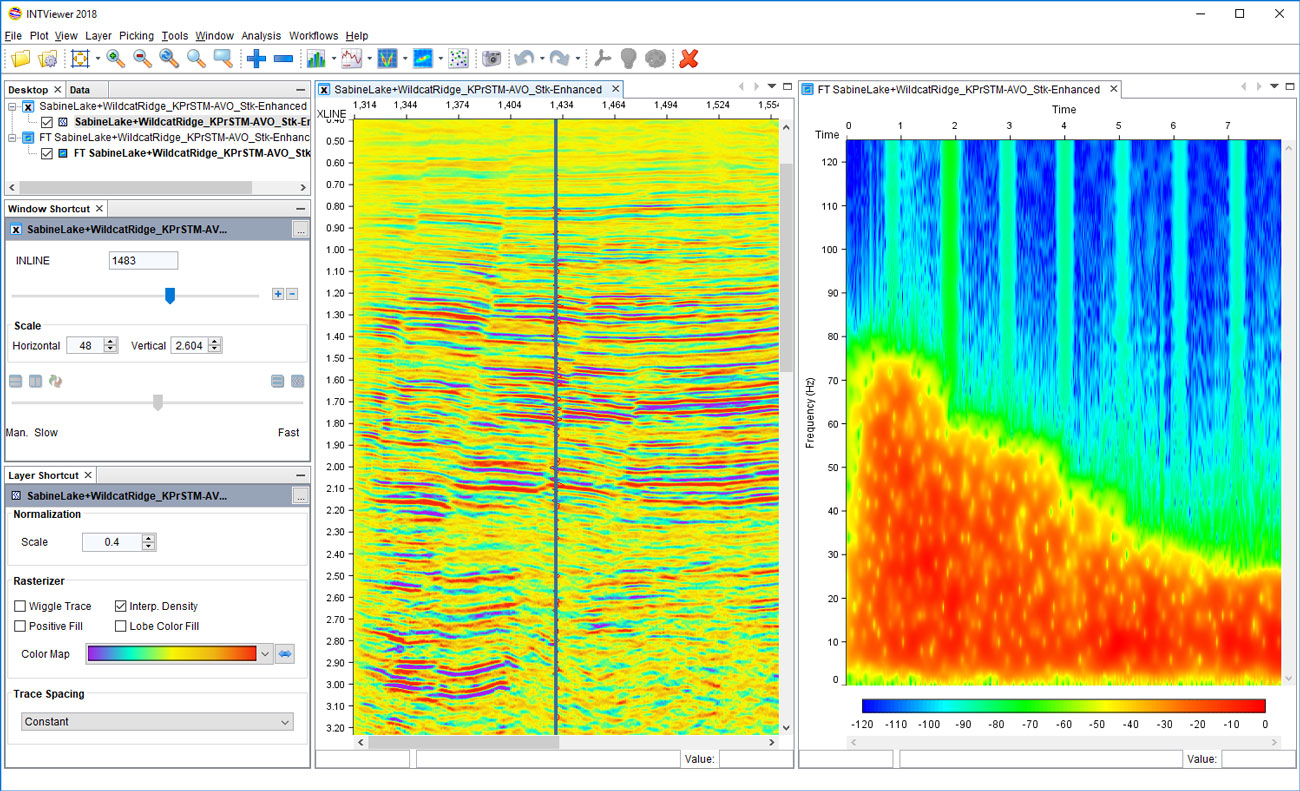
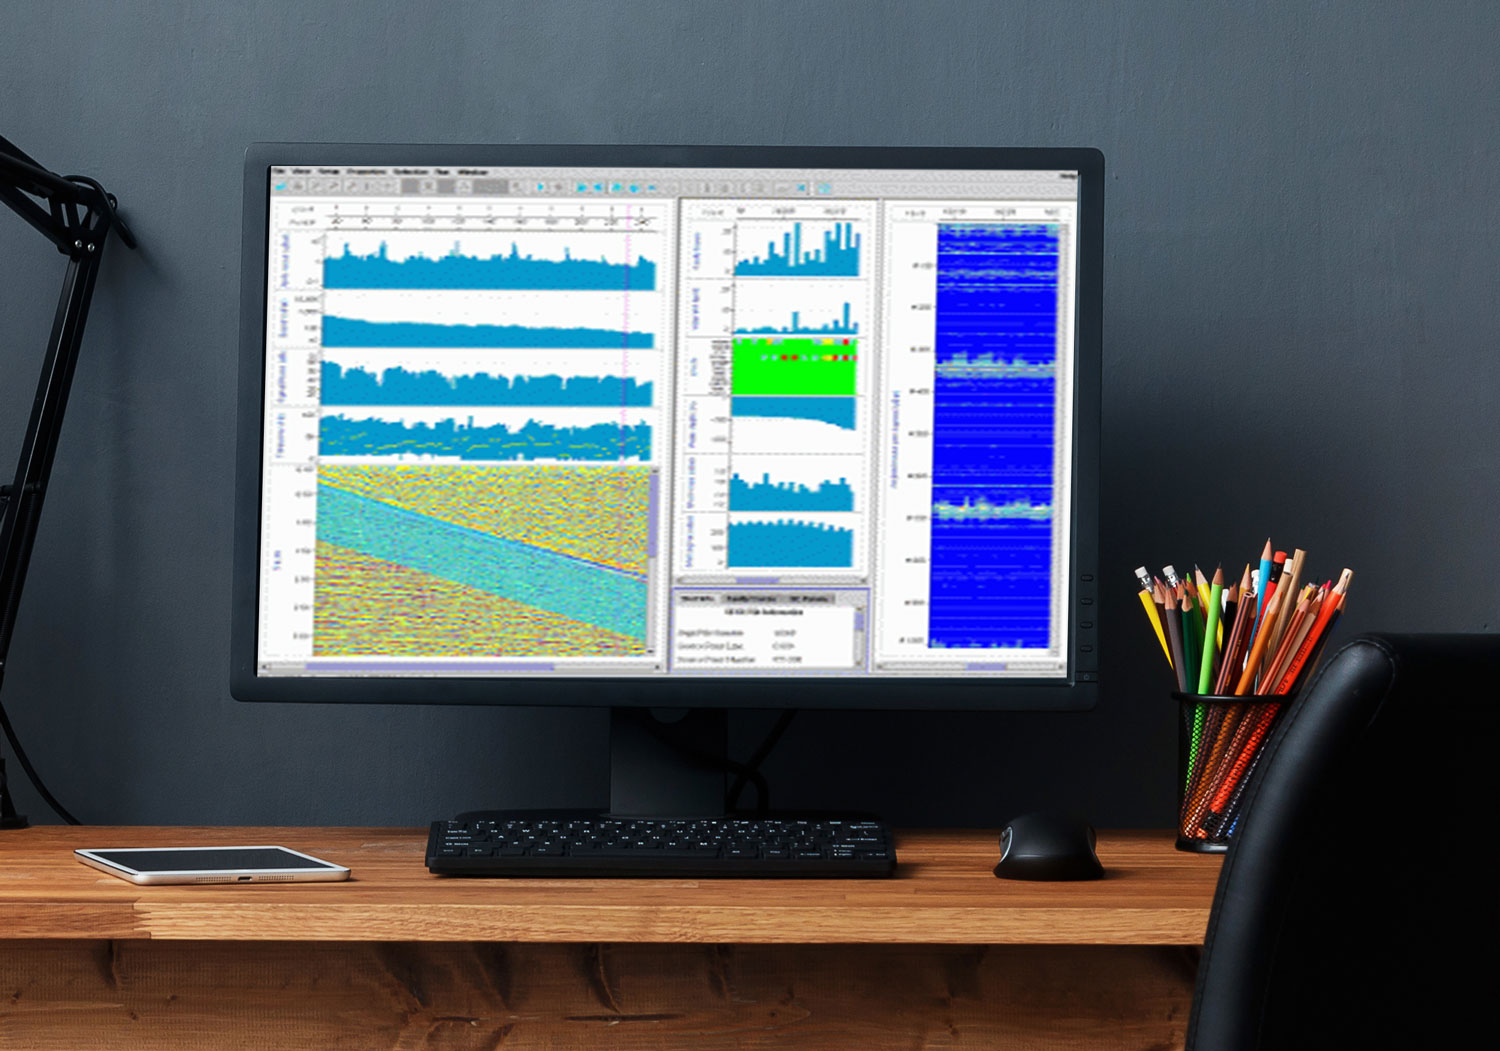
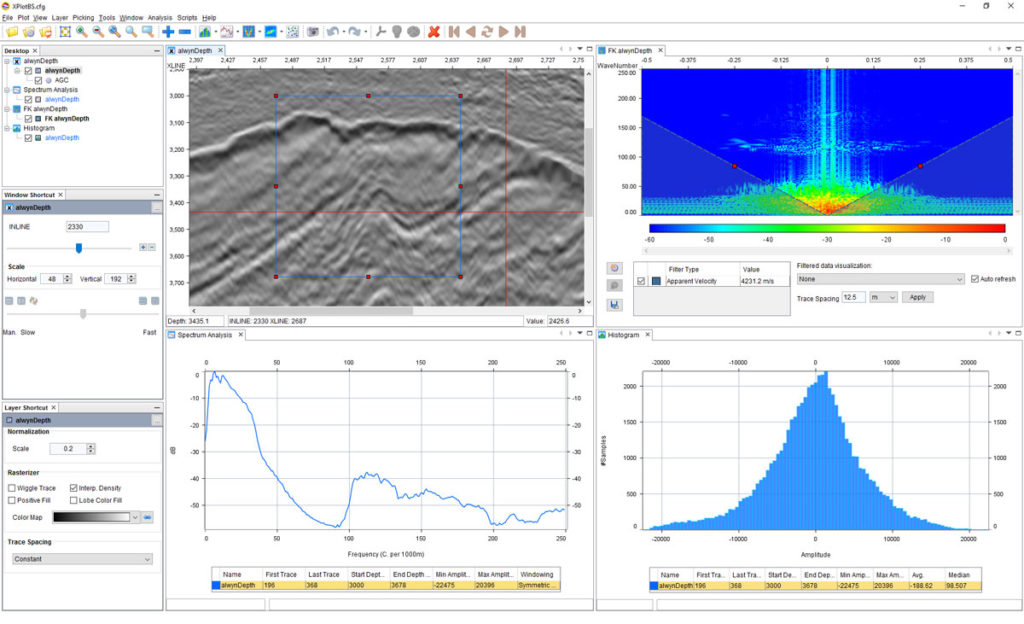
QC seismic frequency and analyze sources of noise, all in the same window.
Detect data anomalies using frequency-time analysis.


More seismic QC capabilities


Seismic Analysis and Interpretation
INTViewer lets you compare and analyze relationships between various attribute volumes on the same grid, gather AVO plots, and display 4D analysis along a horizon. And with INTViewer’s ability to QC horizons in one sweeping view, you can identify anomalies quickly.
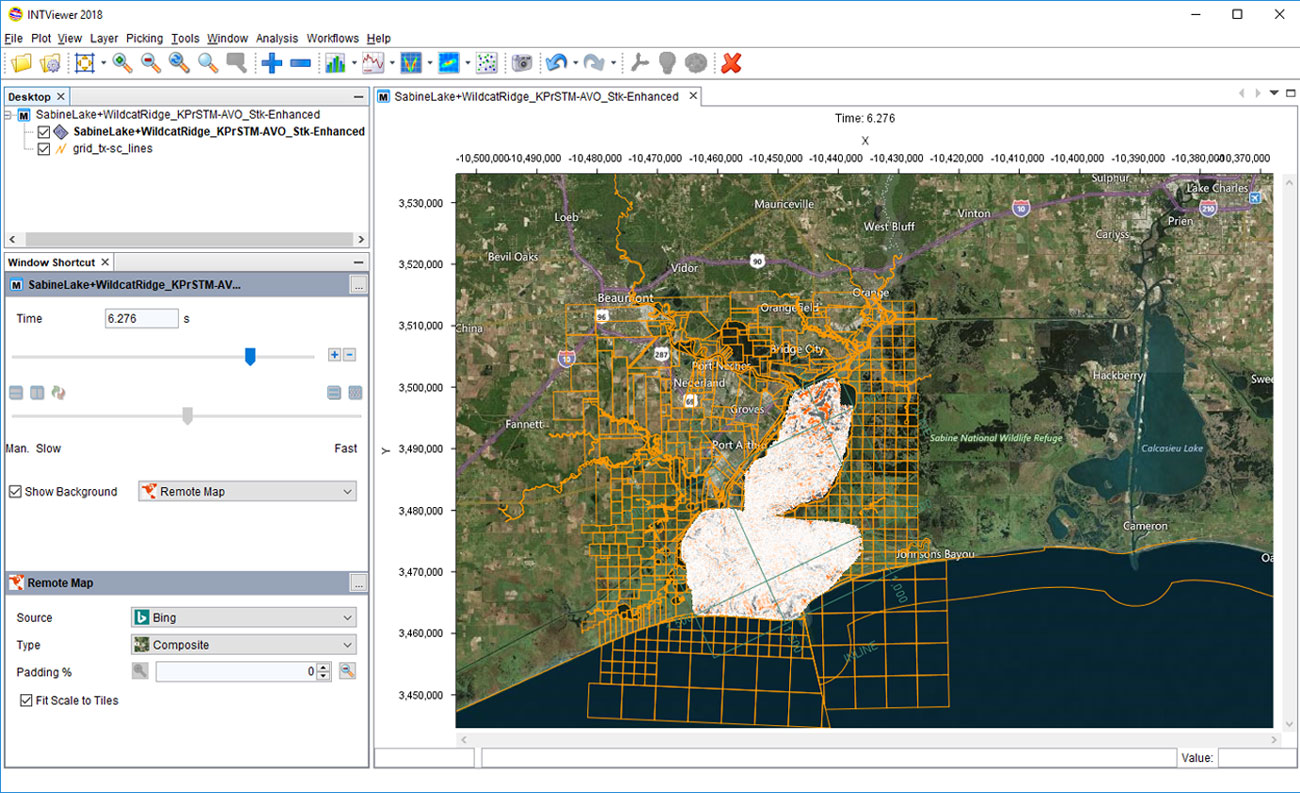
Visually check the positioning and accuracy of the survey and CRS used.
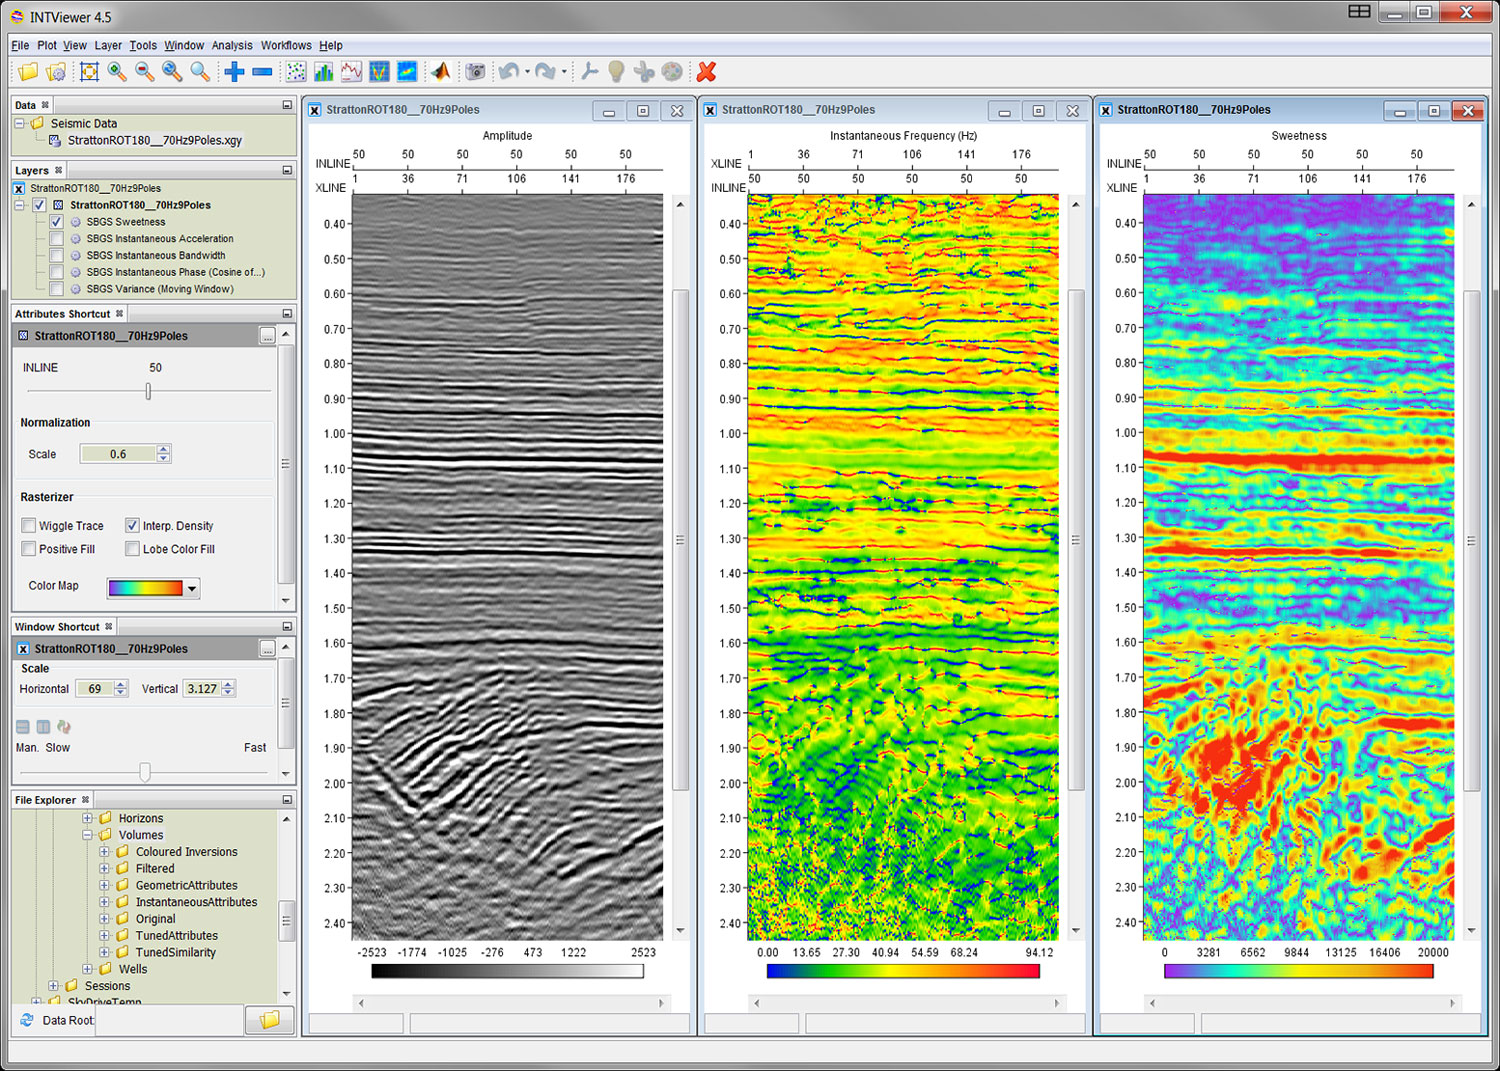
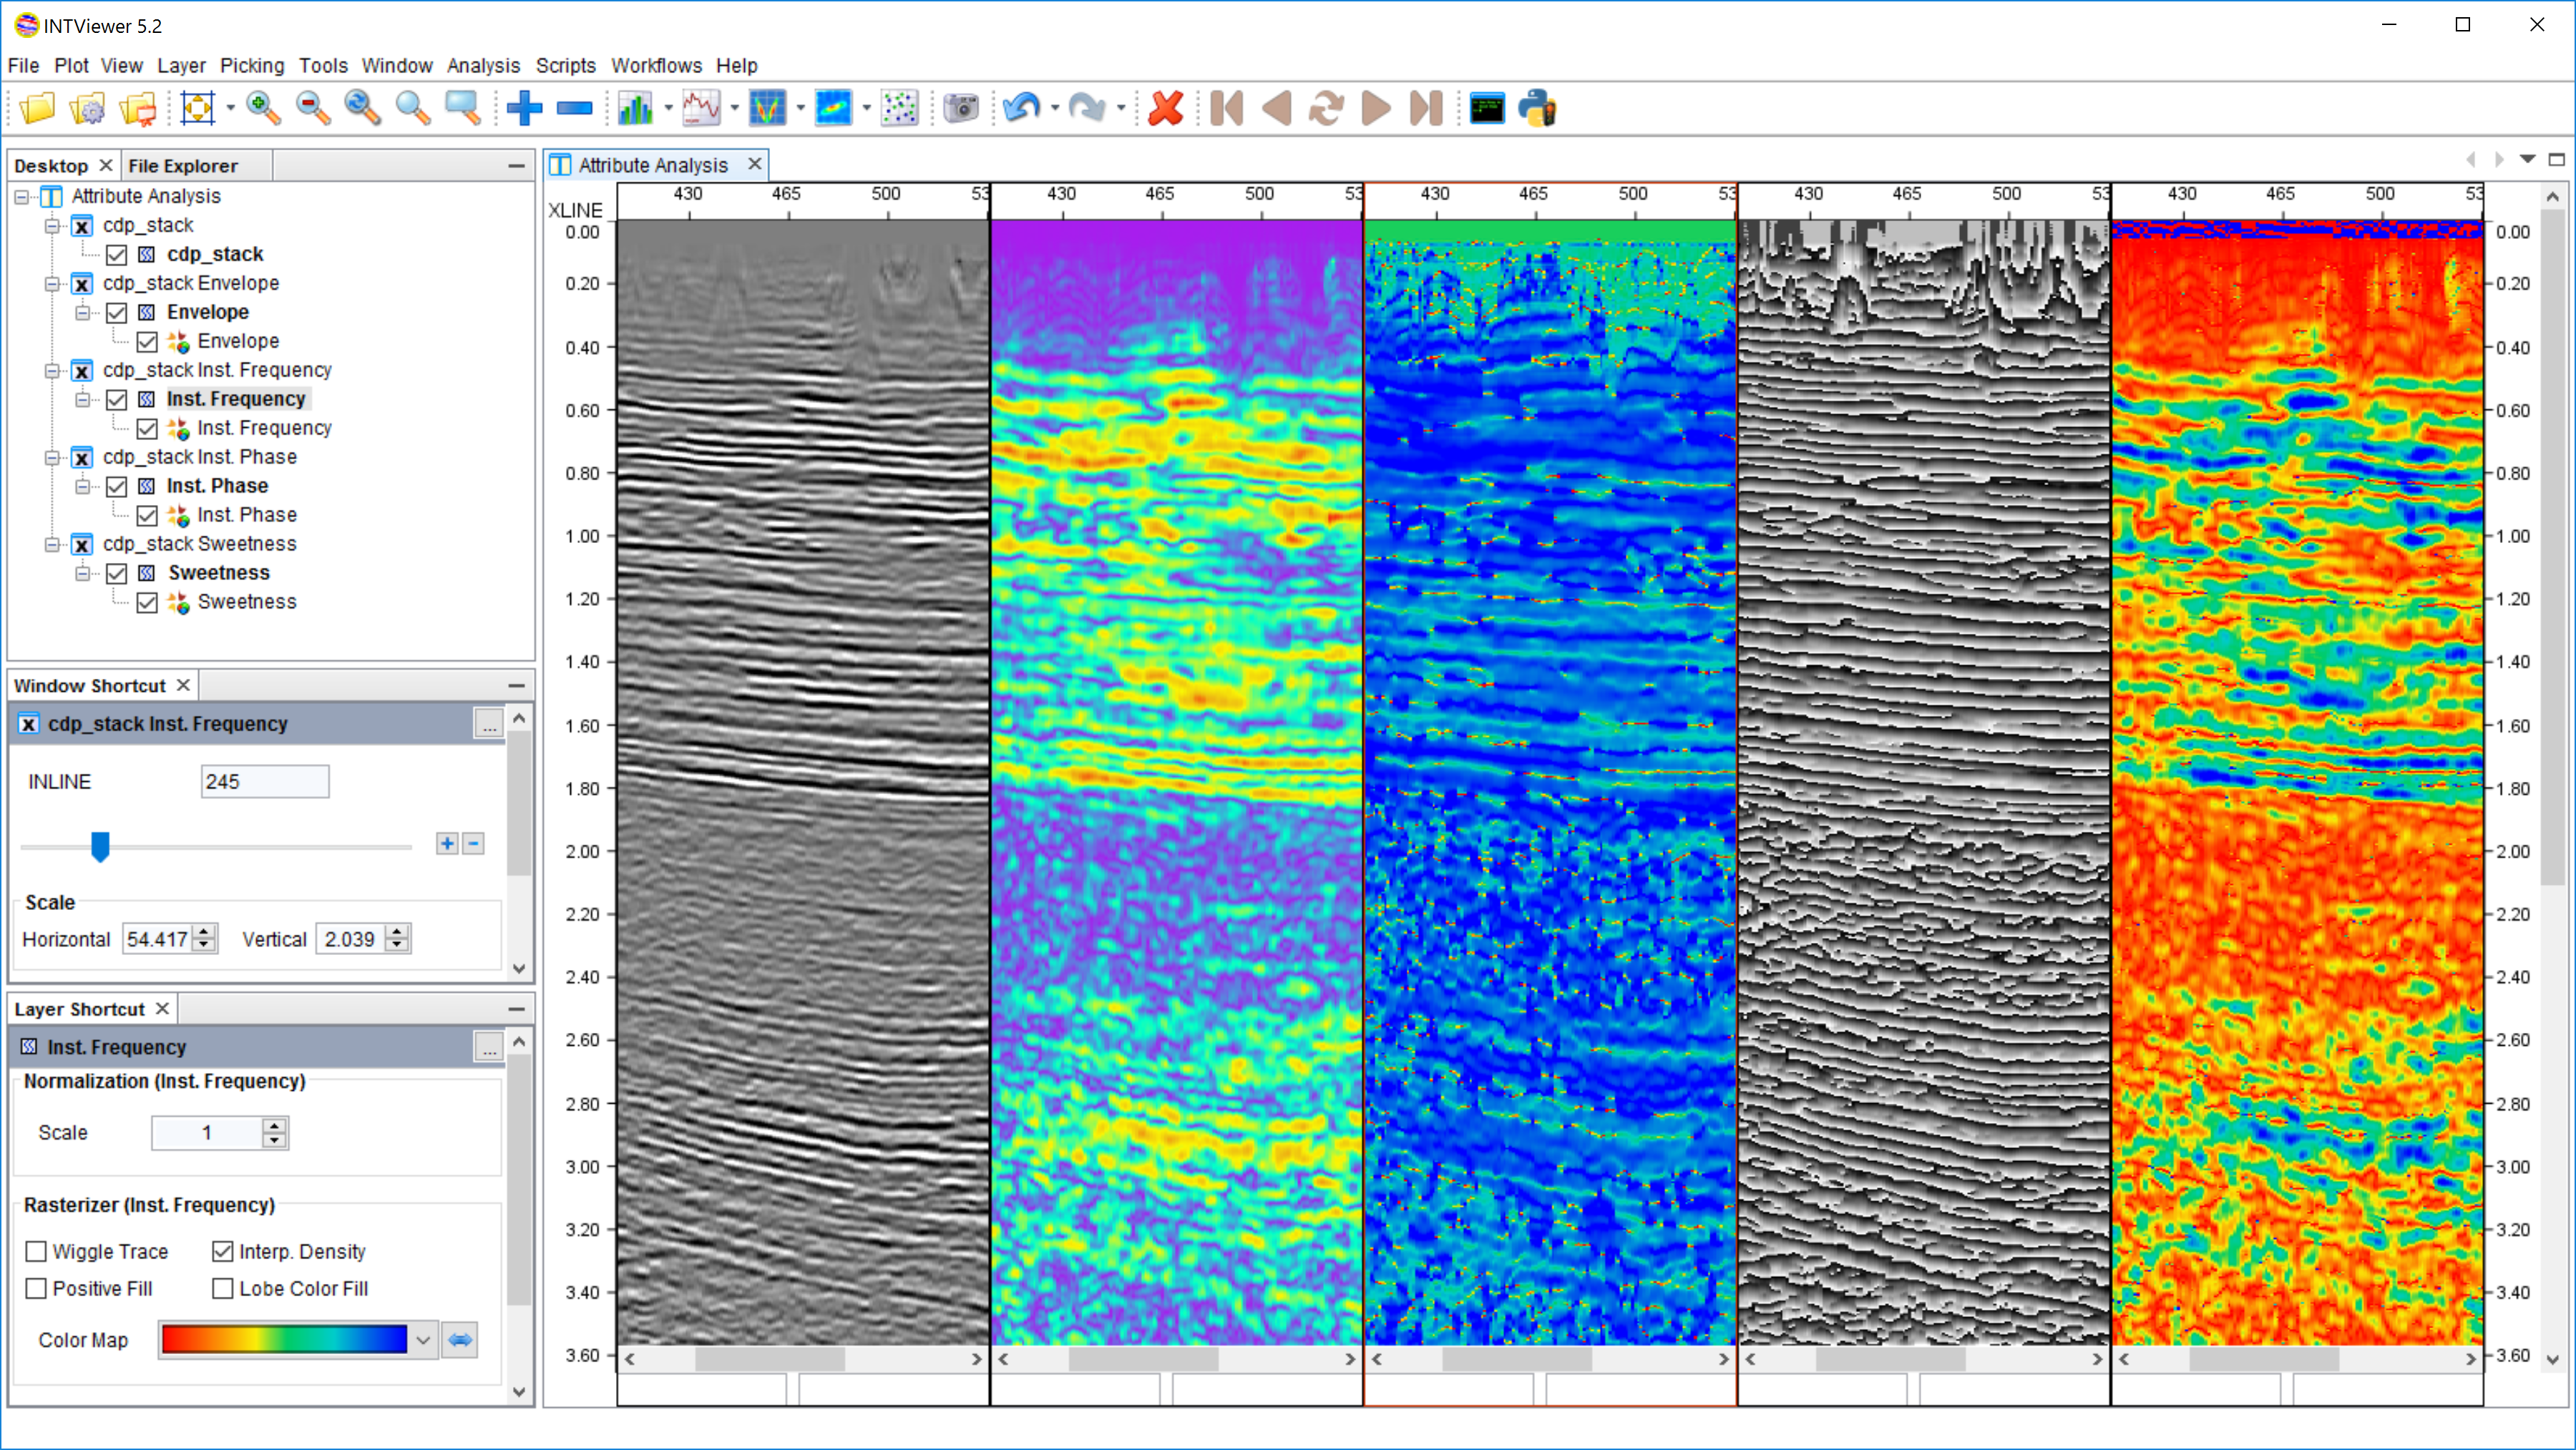
Analyze attributes of your seismic dataset.
beachball
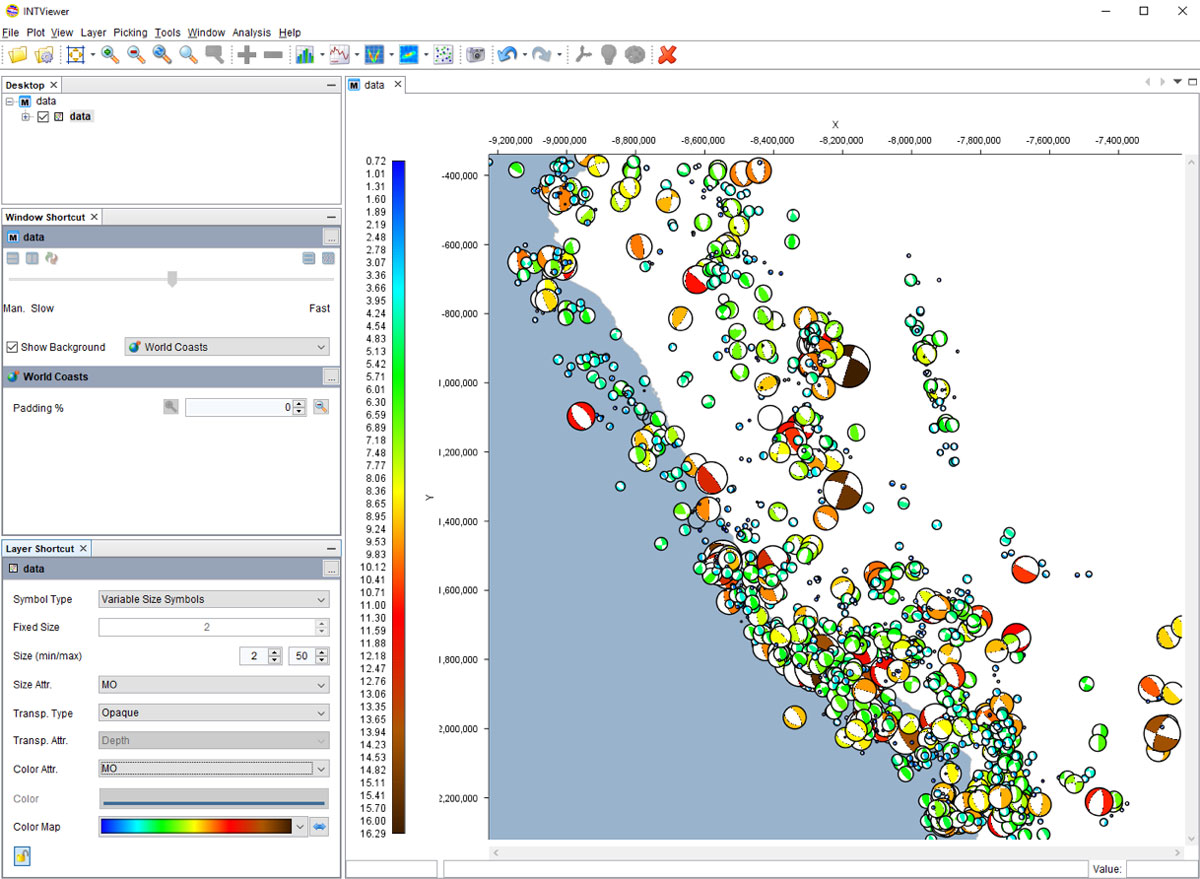
Visualize microseismic data, available in 2D and 3D.


More seismic analysis and interpretation capabilities

INTViewer Features

Request an INTViewer Trial

Extend INTViewer with Prebuilt Plugins or Build Your Own Plugin with Java

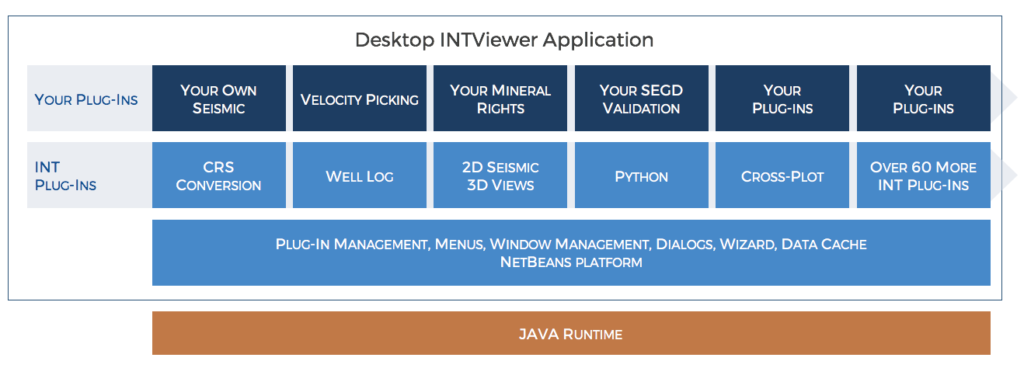
INTViewer’s architecture offers more than 60 plugins, or you can build your own to create a truly custom solution. Some of the current key plugins (2D/3D) include: Well, Seismic, Reservoir, Fault, GUS, PointSet, GridSurface, GOCAD, Normalization, Cross-Plot, Trace Display, Grid Surface, Well Histogram, Velocity Measurement, Horizon Picking, Horizon Calculator, Fault Picking, and many more.
View list of INTViewer plugins


Current Plugins
Mineral Rights: Manage exclusion zones in seismic data to maintain compliance with license restrictions.
Navigation QC: Analyze and QC marine navigation data.
Slideshow: Allows an interactive browsing of seismic, session or Python files in the form of a slideshow.
SSH: Connect to a Python terminal using an SSH client.
Comments: Annotate entire datasets, seismic slices, or specific traces to highlight specific features.
Microseismic: Visualize microseismic events in 2D and 3D windows. Analysis tools such as cross-plots, histograms and timeline/playback are also available.
Saddleback Attributes::Workbench™: Provides a library of 24 single trace attributes using correct transforms, pre-conditioning of the trace.
Horizon Attribute Extraction: Provides analysis, visualization, and statistics for properties along a single horizon, or in windows defined by or between horizons.
Remote Map: Connects INTViewer to a running Web Map Service (WMS) to stream georeferenced map images and associated road, boundary and culture data.
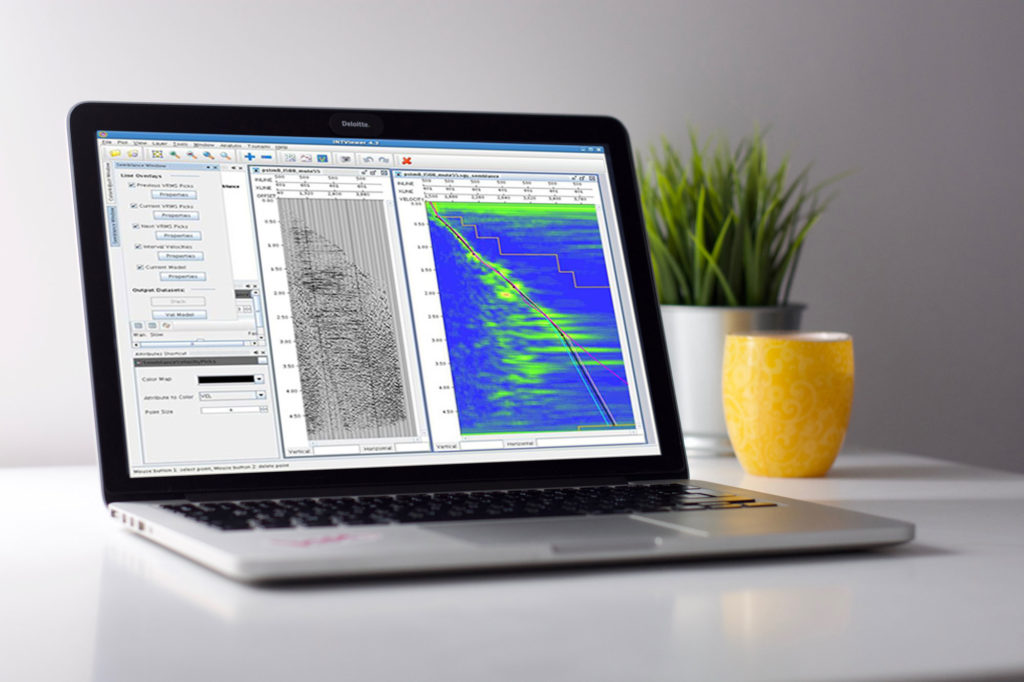
Velocity Measurement: Allows a user to dynamically compute and display velocities on a seismic section.

Seismic Workbench: Automates the processing of seismic datasets through the creation and execution of workflows utilizing external libraries (such as CWP/SU, FreeUSP, etc.).
AngleField: Calculates on-the-fly angle field based on seismic gather and velocity model.
Signal-to-Noise Analysis: Quantifies the signal-to-noise ratio within a user-selected window.The plugin provides the auto-correlation, cross-correlation and signal/noise, as well as some graph displays.
ZGY Data: Provides reading capabilities for the Schlumberger® ZGY/Petrel® seismic format.
Python Filter: Allows a quick prototyping of processing algorithms using the Python language.
Space Mouse Adapter: Improves the navigation within 3D windows by leveraging the 3DConnection mouse.
Lattice Decimation: Decimates a 3D SEGY seismic volume by specifying a step value in each dimension.
Reservoir: Visualize reservoir data in 3D windows. AND MANY MORE …
Go Beyond Your Local Data

Cloud-Ready with INTGeoServer

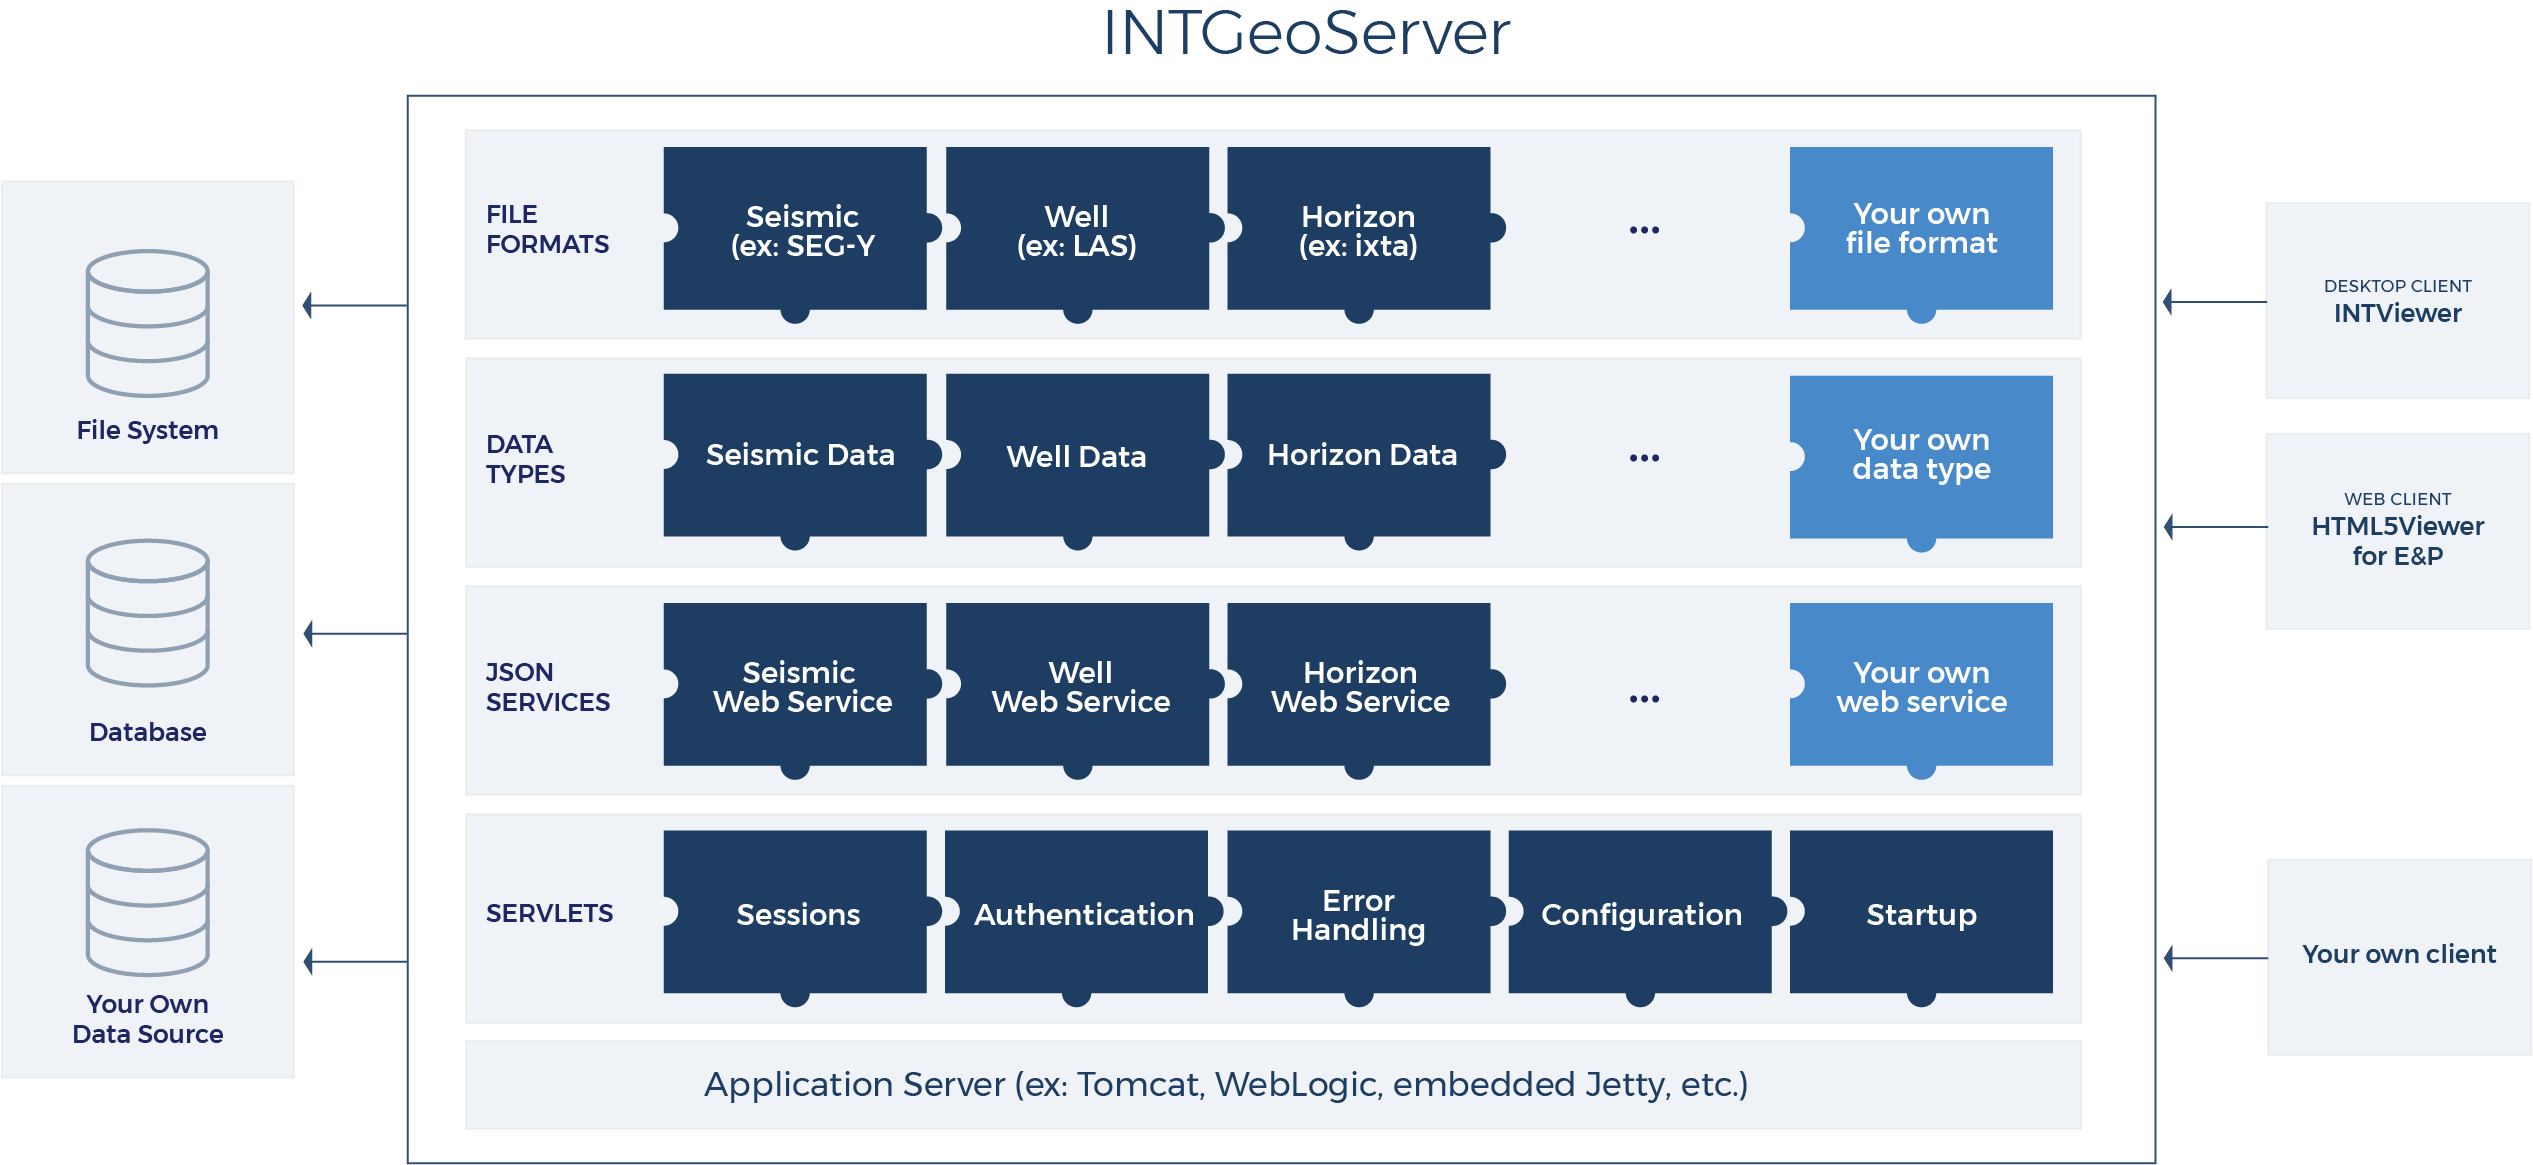
INTGeoServer is a geoscience data server that distributes seismic, well data, and more through the web with no need to set up file sharing. Included with each license, hosting with INTGeoServer makes your INTViewer data accessible from anywhere in your network. With access optimized for remote display, your geoscience becomes instantly ubiquitous: It can be accessed either from INTViewer or browser-based IVAAP.

Partners Who Built Geoscience Solutions with INTViewer

Our partners have considerable experience developing geoscience algorithms, workflows, and technical tools. By building on our software and expertise, using INTViewer not just as a plugin, but as a complete white-label solution, these companies were able to rapidly deploy and commercialize their custom geoscience application and significantly reduce their time to market. Here are just a few examples:

RPT-logo RPTAS_95782772_main2 Quantitative Reservoir Interpretation Package

Rock Physics Technology (RPT) wanted to commercialize the quantitative interpretation algorithm they developed, so INT integrated RPT’s workflows with INTViewer’s customizable platform to create a solution that allows the whole team to perform inversion and reservoir characterization on seismic data.

Read the Case Study

wireless-seismicRemote Visualization with INTViewer Drones, IoT, and Advanced Onsite Seismic Data Validation

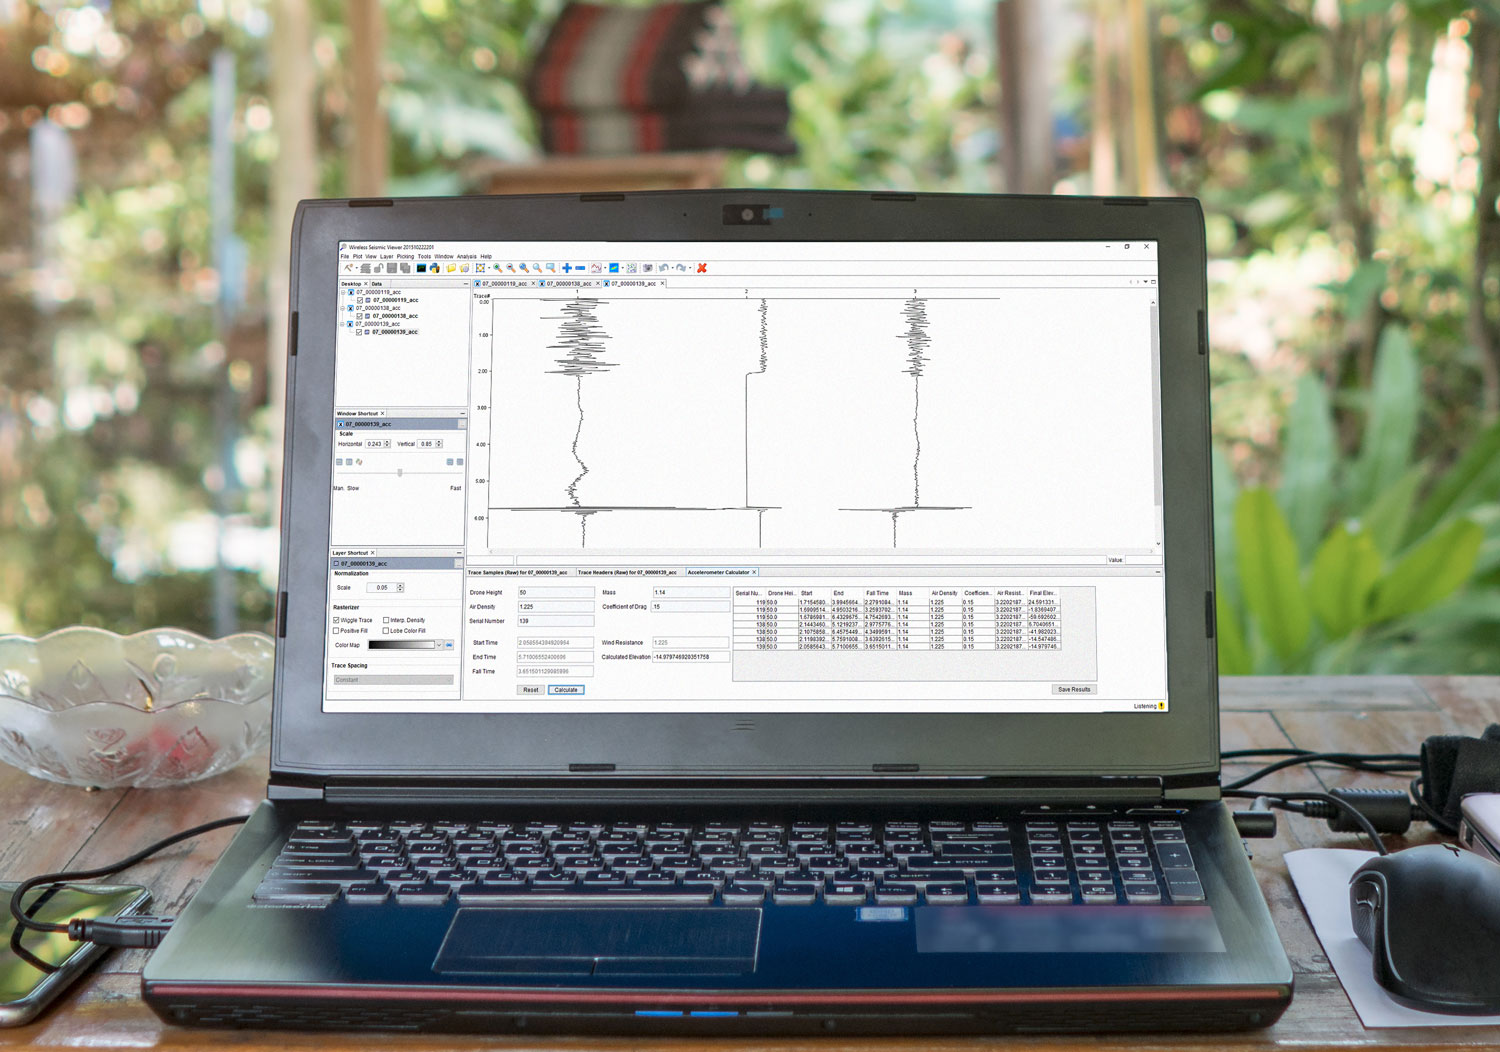
For complex environments with hard-to-access topography, traditional acquisition and imaging methods can be expensive and hazardous. INTViewer allowed Total and Geokinetics to QC seismic data acquired by Wireless Seismic using drones in the field in Papua New Guinea, without wasting time, effort, or resources.

Read the Case Study

sercel-logo

Sercel chooses INT J/GeoToolkit New Generation Quality Control Tool for SEG-D Data

To build their custom SegdToolbox, Sercel, a leading player in the seismic acquisition industry for more than 40 years, needed a software platform that could support long-term growth and handle millions of data points with ease. INTViewer’s built-in ability to visualize seismic traces and extensibility proved a perfect fit.

Read the Case Study

tsunami200x200tsunami-screenVelocity Modeling in Seismic Migration

Tsunami wanted to develop a single, easy-to-use solution to help develop workflows that allow users to quickly and accurately build good velocity models that include time and depth as well as the additional modeling needed for anisotropic migrations.

Read the Case Study


Partner with INT to Build Your Custom Geoscience Solution

“We are utilizing INTViewer in so many different ways and are incredibly pleased. The students really like using the software as well; the learning curve for basic functions is very small, which helps a lot.”

— Asst. Professor Bobby Reece Dept. of Geology and Geophysics, Texas A&M University

Bobby Reece A&M

Technical Specs Overview

Main Visualization Capabilities:

Latest Product Videos

Customize INTViewer with Python

3 Ways to Find Optimal Normalization Limits

Seismic Reporting Tool—Export Your Seismic Data

Build Interactive Slideshows

You Might Also Be Interested In:

Ready to get started?

Request a Trial

Check out our latest release

INTViewer 2023.1