The release of INTViewer 5.2 is just around the corner. With it, there are around 100 new features and improvements. As a quick preview, I’d like to focus on one of them, a favorite of mine, the Normalization widget.
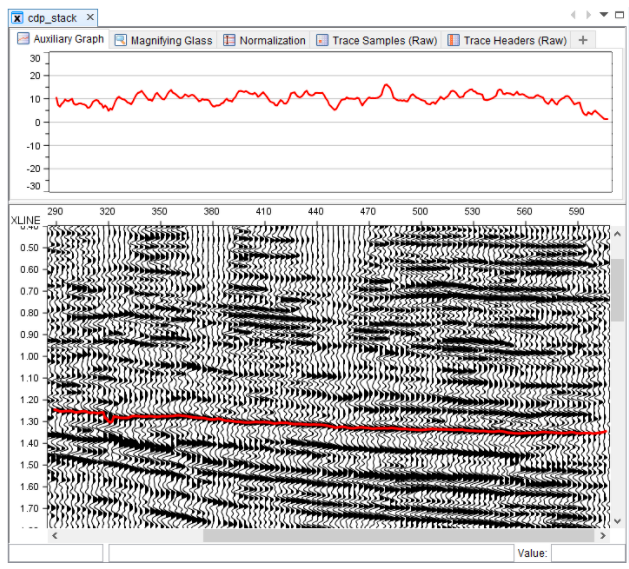
The Normalization widget is part of the new “Auxiliary Widget” feature set. If you are familiar with INTViewer, you have probably used the Auxiliary Graph before to inspect variations of amplitudes along horizons or just seismic header values. INTViewer 5.2 generalizes the concept of an area located right above a XSection window. Not only is this area now resizable, but it can also show multiple tools.
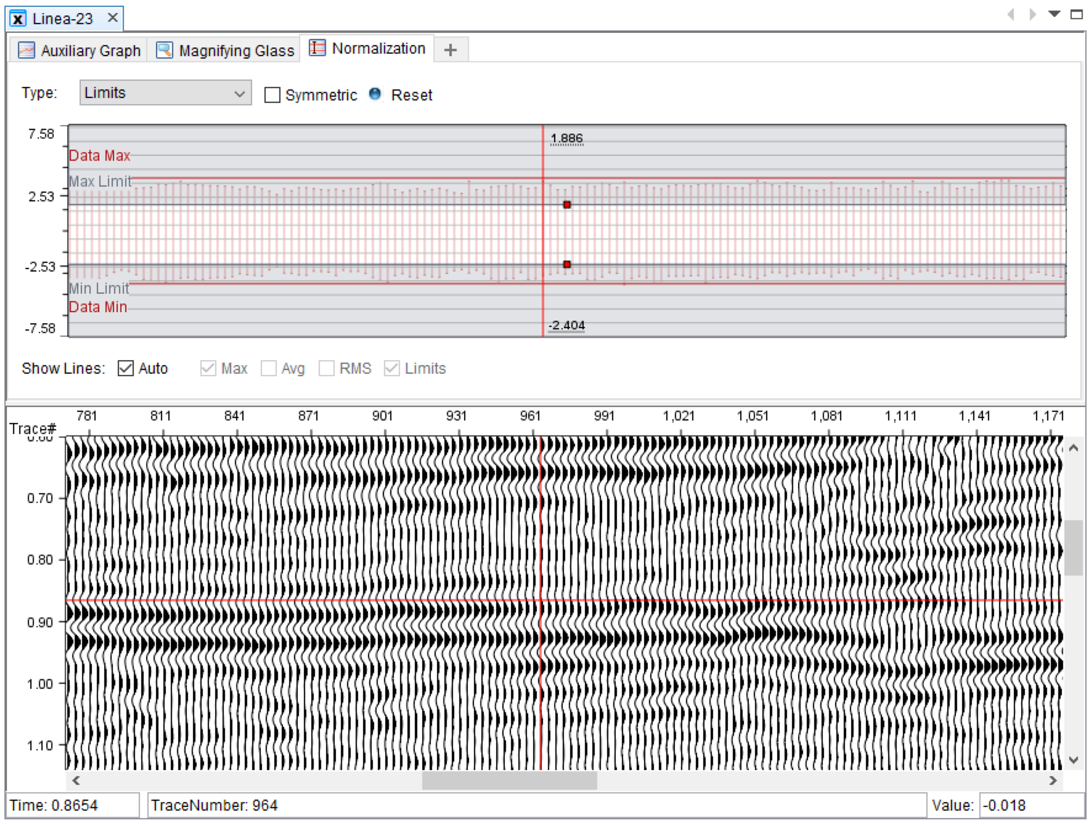
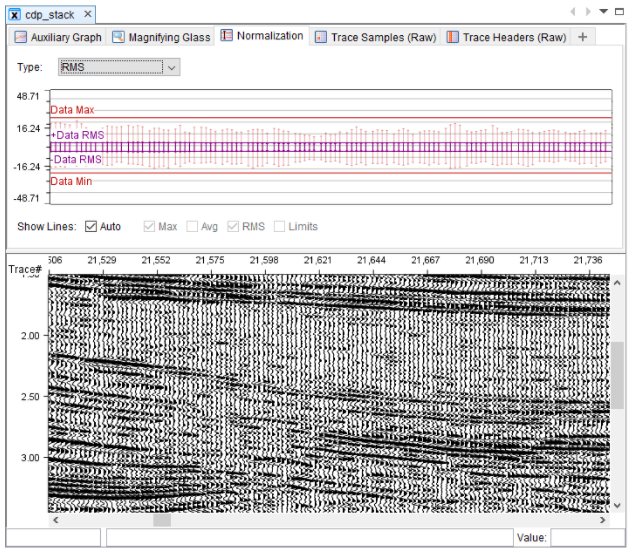
The Normalization widget is one of these tools. It shows graphically how your current selection relates to the minimum and maximum amplitudes of the entire dataset. There are several normalization options in INTViewer: RMS, Maximum, Limits, etc. Until now, there wasn’t a graphical way to decide which option works best for your data. The widget’s plot shows the minimum and maximum of each trace displayed. If you picked the RMS option, the RMS of your dataset is shown as a horizontal line, and the RMS of each trace is displayed as a vertical line.
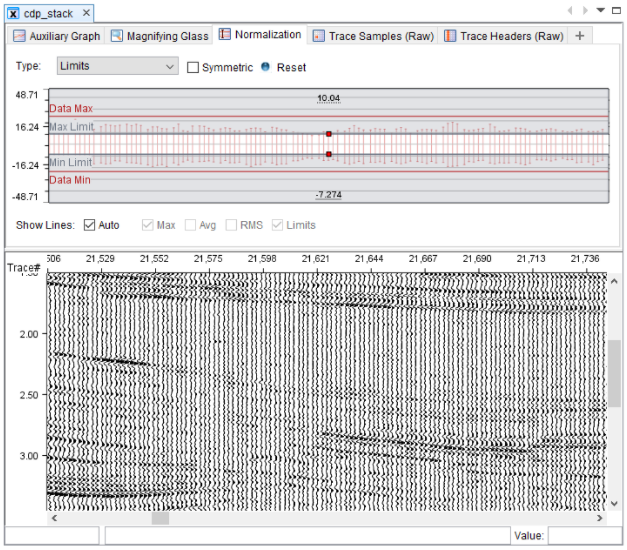
The Limits normalization type is often used when you perform a rapid QA of your data. Some customers even make Limits the default normalization type. The Limits normalization requires the entry of a minimum and maximum. The Normalization widget makes the selection of this range graphical and interactive. You no longer have to enter arbitrary values blindly. Just drag the minimum and maximum curtains in the widget and your visualization will update automatically.
As part of the preparation for the INTViewer 5.2 release, we worked with a few professors at Texas A&M and found that the Normalization widget is a great tool for teaching the different types of normalization. All seismic packages have nearly identical normalization capabilities. INTViewer is the only application of its kind providing such an effective way to make an informed decision about which normalization type to pick.
INTViewer 5.2 is a major release with many new features deserving a closer look. One of our next posts will talk about how developers can easily add their own auxiliary widget.