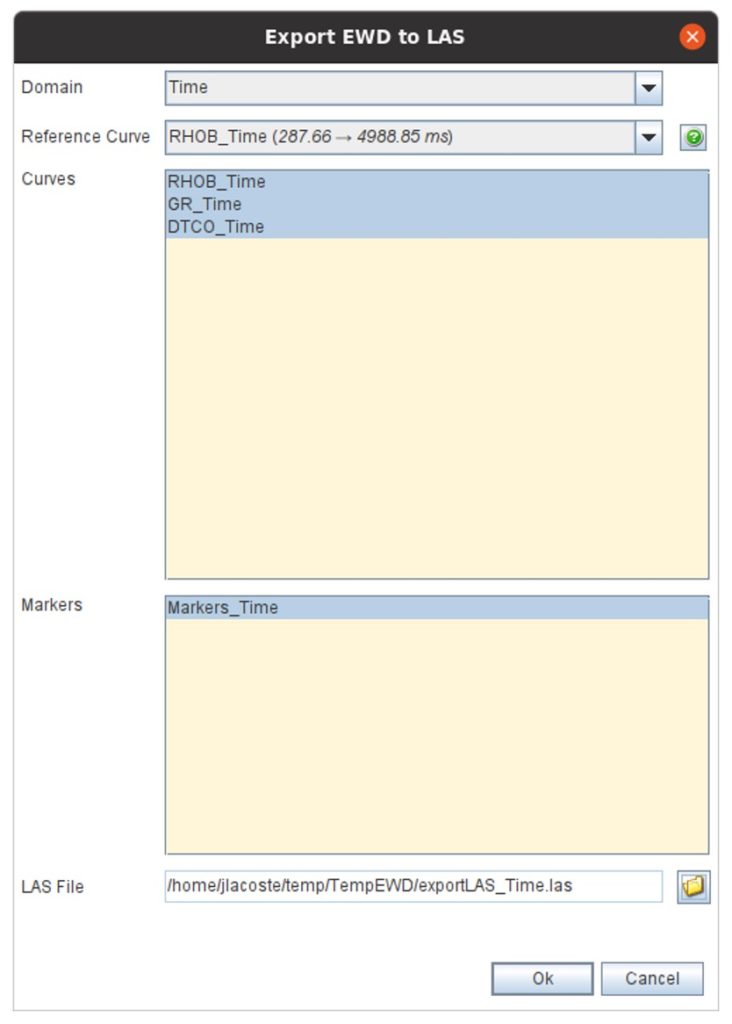
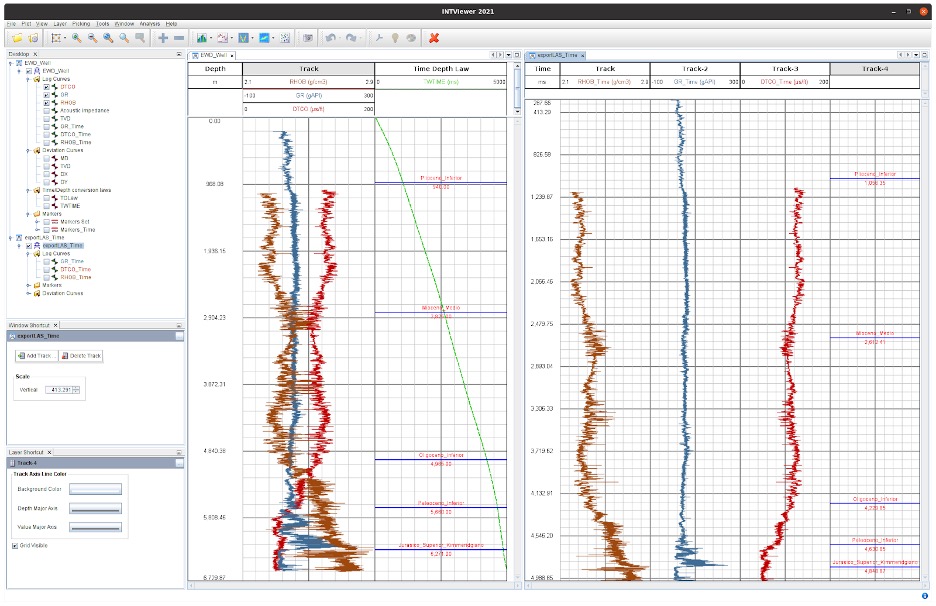
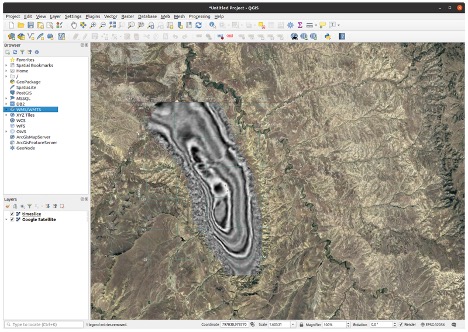
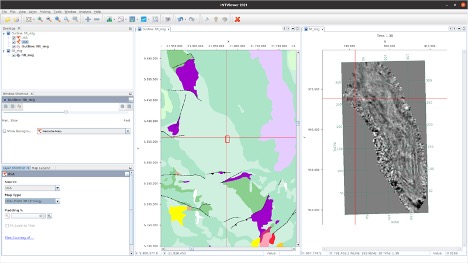
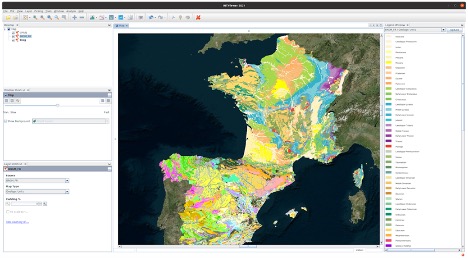
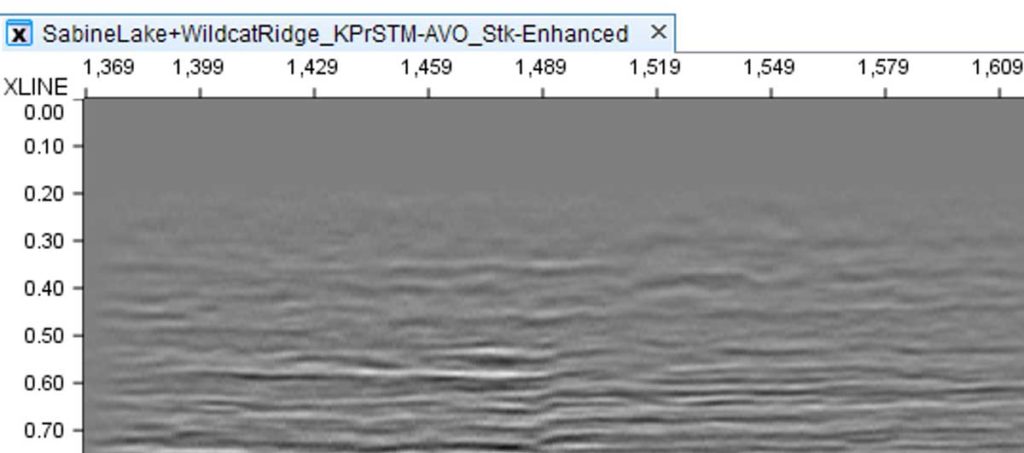
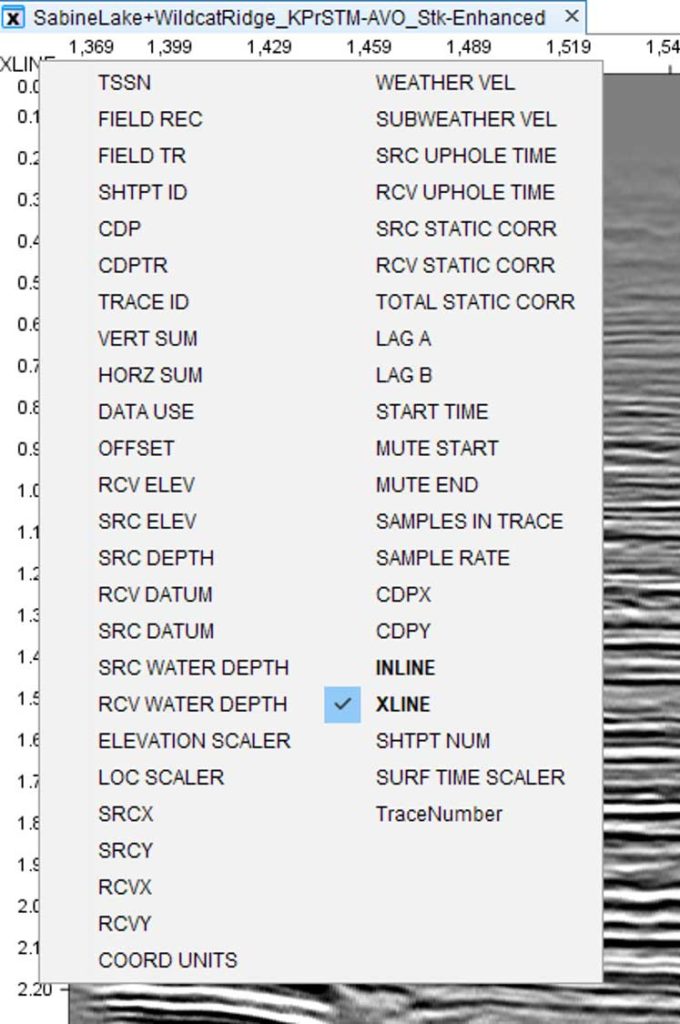
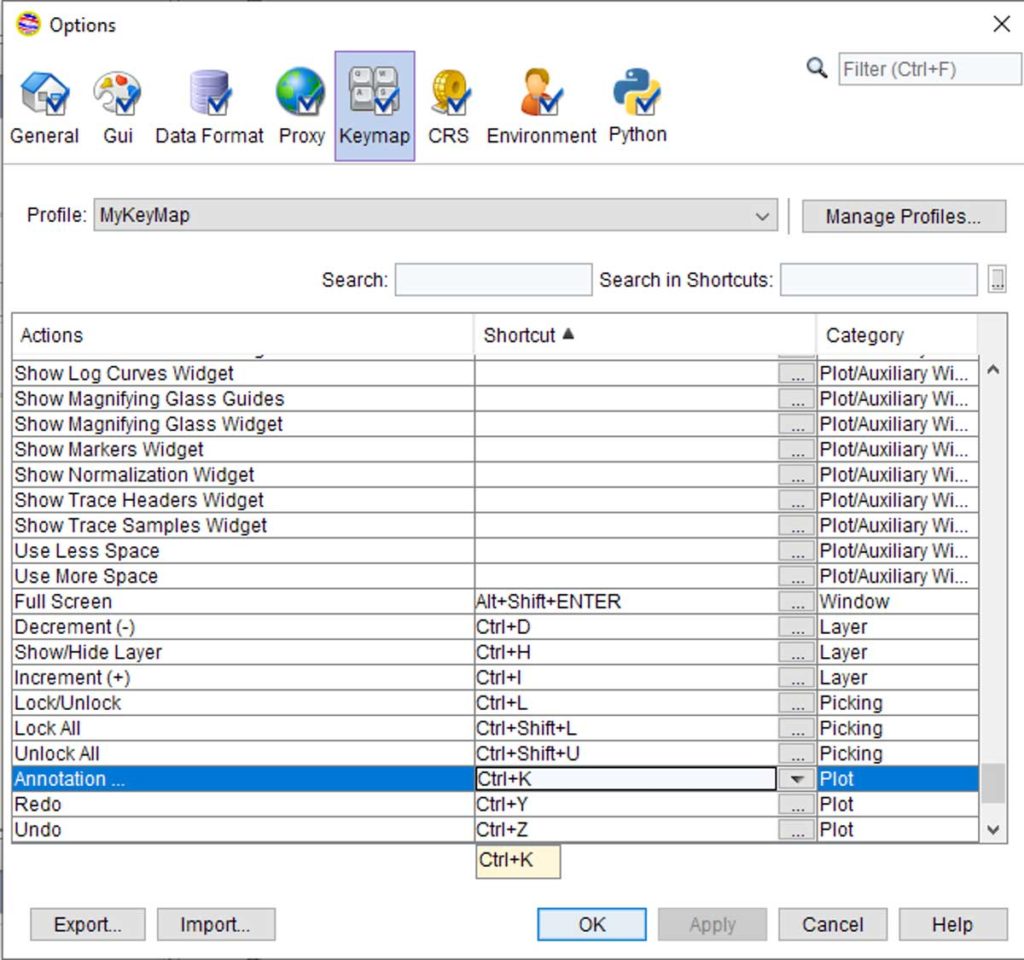
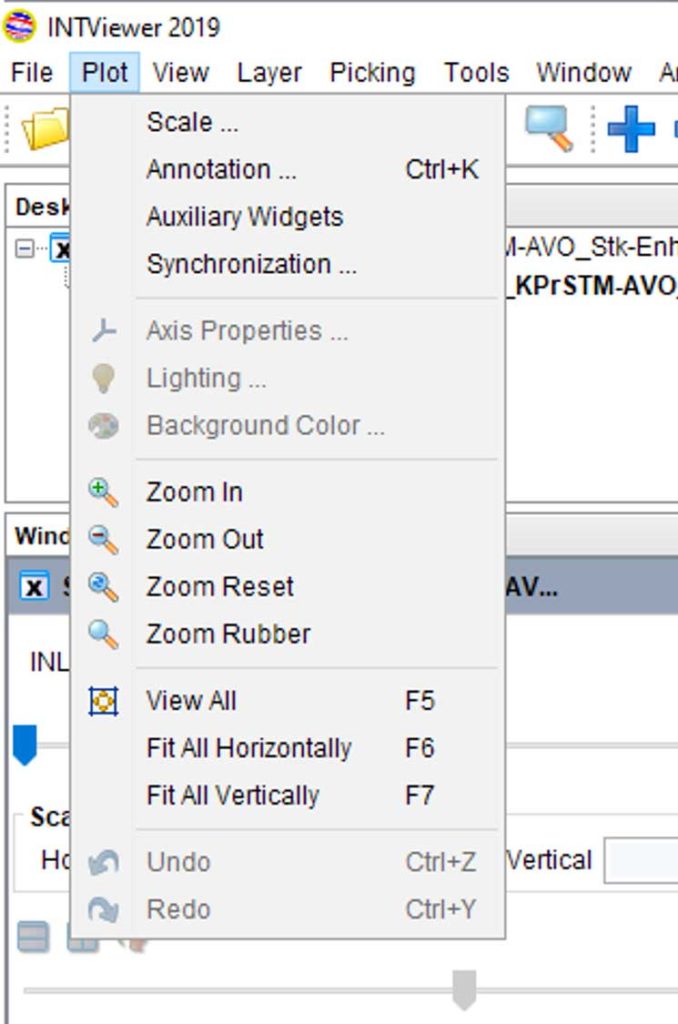
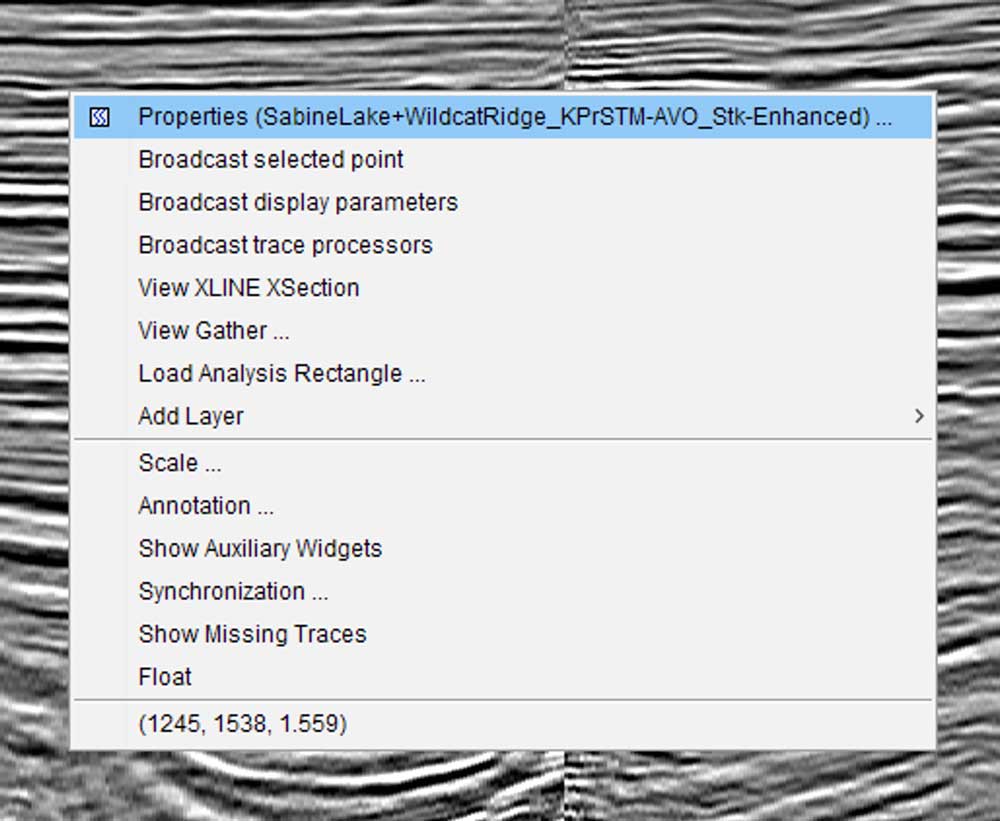
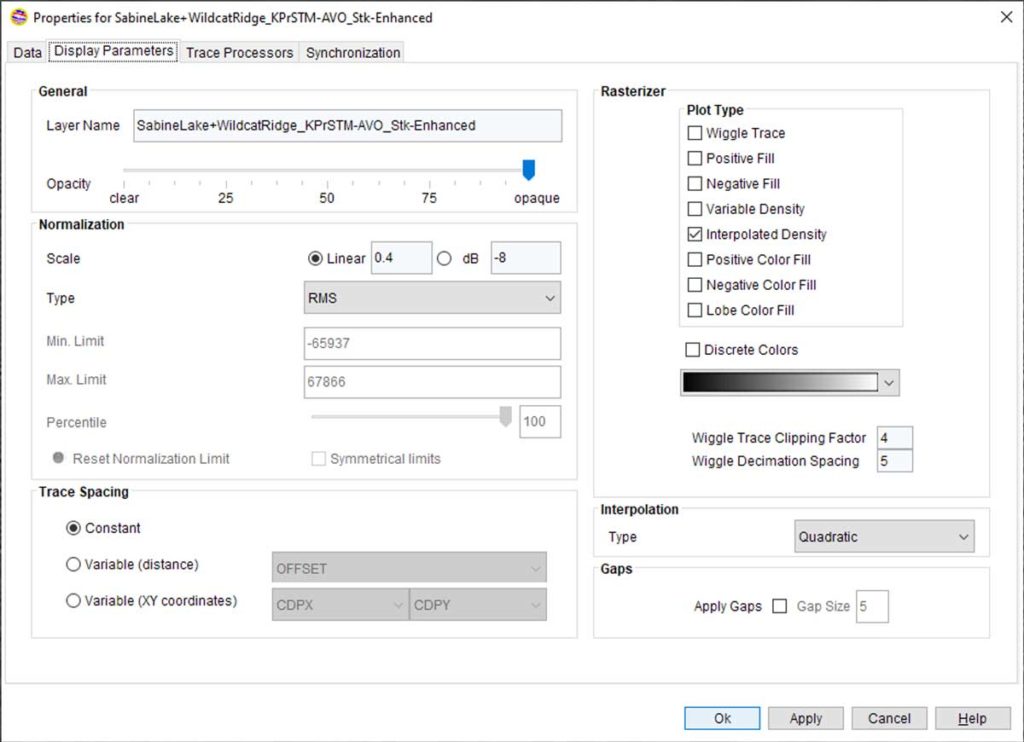
Feedback is key to the improvement of any software. INTViewer has many long-time users, and one piece of feedback that I sometimes receive is that “it takes too many clicks to reach an often-used feature.” Fortunately, with many years of real-world usage under its belt, the usability of INTViewer has been fine-tuned. These “missing” shortcuts are already built-in, I just didn’t do a good job communicating these improvements to our users. So here is our list of the 5 most overlooked INTViewer shortcuts.
INTViewer
A Countdown of INTViewer’s Features for the Cloud
2019 has been a year full of milestones. INT celebrated its 30 years and has made IVAAP available to all members of the OSDU consortium as part its demo release. But this year has seen many more achievements, and among them is the consolidation of INT products as a complete ecosystem, an ecosystem centered around geoscience data, built for the cloud.
5 Simple Techniques to Avoid Bugs While Programming
Programming is an activity that requires a special set of cognitive skills. While the industry has developed processes and tools to ensure the quality of software artifacts, the act of writing code is a craft in itself. Developers pride themselves on the “big picture” results they achieve, but the activity of programming is definitely a humbling experience: it’s easy to introduce bugs, and regardless of whether I catch them right away or later in the pipeline, I hate to be reminded I am inherently flawed and have introduced a defect. For this article, I will focus on simple methods to avoid bugs, not before or after you write code, but while you write that code.
What We Learned about the Future of NetBeans from the Last 2 Years
It’s been two years since Oracle announced the donation of the NetBeans source code to the Apache software foundation. This move was much more than a licensing change — it was a bit of a new beginning for NetBeans. With the release of NetBeans 10, now is a good time to look back and recognize the changes that this transition to Apache brought.
How Window Synchronization Facilitates Visualization of a Large Number of Datasets
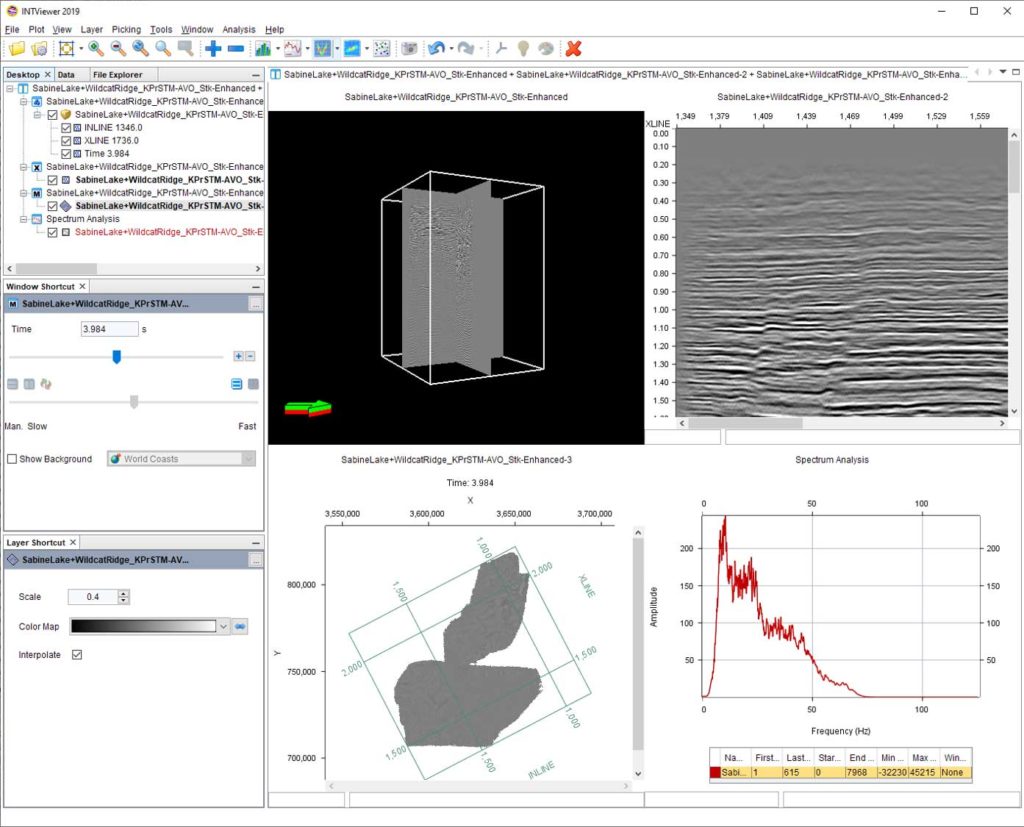
While some customers will use the portability of INTViewer to present their data, others will use INTViewer on a workstation, with multiple monitors. And instead of opening a handful of windows, they will open a few dozen. The typical use case for opening a large number of windows is when you want to monitor the multiple steps of a processing workflow. In such a use case where datasets are compared, it’s important that all visualizations share the same settings. INTViewer makes it really easy to open dozens of datasets at once. You can select a directory and open in one click all the datasets within that directory. But this is not where INTViewer’s productivity stops. Automatic synchronization facilitates the management of all these windows.
Using INTViewer to Visualize Earthquakes and Other Seismic Activity
I often have a hard time explaining to friends and family what exactly INTViewer does. The moment I use the word “seismic,” the listener’s mind automatically shifts to the topics of seismic activity and earthquakes, and I need to explain oil & gas exploration technologies before I even get to the software. By then, I have lost my audience. Today, I’ll try a different technique: I’ll describe the capabilities of INTViewer that actually cater to earthquake mapping. I will show how you can use the built-in capabilities of INTViewer to map recent earthquake activities.
5 Ways INTViewer Makes Offline Visualization Possible
I often say that INTViewer is a bit of Swiss knife. It serves multiple purposes, and each company finds a different use. This makes it hard to decide which feature to highlight. In the past few years, as the industry moved to the cloud, we created a companion for INTViewer: INTGeoServer, which makes it easy to visualize data beyond the bounds of your network. This year, with the new release of INTViewer approaching, I will highlight the opposite feature of INTViewer: its ability to work offline, disconnected from the world.
Installing the Seismic Unix Library on Windows [Walkthrough]
In our previous blog, Simplifying the Learning Curve of the Seismic Unix Library, we described how INTViewer can leverage the SU library. This library is typically meant for Linux, but it can also be used on Windows. This walkthrough describes how to install the SU Library on Windows 10 to use the Seismic Workbench plugin.
How the NetBeans Module System Helps Us Maintain Compatibility Between Releases
Two decades after its creation, the Java runtime has finally become modular. A modular approach not only makes dependency management easier, but it also makes applications more efficient as unused modules don’t need to be loaded. The NetBeans Platform predates Java 9 and has been using its own module system for years. Since INTViewer is a desktop application built on top of the NetBeans Platform, I find that it is far superior to the Java 9 module system for my use cases.
Simplifying the Learning Curve of the Seismic Unix Library
INTViewer provides a graphical user interface for the SU library, reducing the learning curve. The Seismic Workbench is a free plugin that has the documentation for the SU library built in, making it easy to find a particular command and all the parameters that this command requires. INTViewer builds the full command line for you based upon all individual commands selected.
How to Create Interactive Slideshows (VIDEO)
Presenting data to clients regularly poses many challenges, especially considering that today’s datasets are more likely to exceed a petabyte or more. Slideshows that may take hours to create are often instantly obsolete and frequently don’t fully answer your clients’ questions. With one simple plugin, INTViewer transforms the art of showing data to your clients by combining the simplicity of a slideshow and the power of live data.
3 NetBeans Shortcuts to Help You Be More Productive
I have been using NetBeans daily for about 8 years, so I’d say I am pretty familiar … with the features I use all the time. Over the years, friends and colleagues have shown me that there are faster ways to get the job done. I have gathered in this post three shortcuts that I learned from others and that you can also use when you develop an INTViewer plugin.
Accessing INTViewer Remotely
In our blog post on Microsoft Azure, we describe various ways customers can move their data to the cloud. In the configuration where INTViewer is hosted on a remote server and needs to be accessed from a local workstation, a Teradici client is one solution. These configurations are increasingly popular with our customers. For performance […]
Picking Horizons in INTViewer 5.2
Horizon picking is a feature that INTViewer has included from the start. However, after discussing with several long-time users, I have found that the evolutions brought by each release can be missed. The release of INTViewer 5.2 is a good opportunity to tour basic picking options. First, a bit of terminology. The term “horizon” in […]
Overlaying Shape Files on Seismic Surveys
In our post, “Closer Look at Coordinate Conversions,” we allude to the capabilities of INTViewer with coordinate system conversions. One benefit of on-the-fly conversions is the ability to see your seismic data in context. In the example below, a time slice is reprojected to the coordinate system used by Google Maps. Showing satellite […]
Visualize Microseismic Events with INTViewer Plugins [Walkthrough]
INTViewer is well-known for its seismic analysis capabilities. Among the less well-known plugins, there is a set that always impresses during demos: the microseismic plugins, a set of four plugins that allows INTViewer users to visualize microseismic events.
New Window System for INTViewer 5.2
If you are already a user of INTViewer, the first thing you will certainly notice when you open INTViewer 5.2 for the first time is the new window system. The way windows are laid out on screen has changed, introducing tabs to browse through these windows.
A Closer Look at Coordinate Conversions
INTViewer makes coordinate conversions virtually transparent to users. Users pick two Coordinate Reference Systems (CRS), one for their data and one for the visualization map, and the visualization updates automatically. How does INTViewer do it? The short answer is “it depends”. The long answer is that the strategy used varies based upon the CRSs selected, […]
Extend INTViewer with Java
INTViewer provides many features off-the-shelf, but its extensibility is unique. Developers can customize numerous aspects of INTViewer by extending the INTViewer platform. And one way to extend this platform is to write Java plugins.
Choosing the Right Coordinate Reference System
Sometimes, you don’t need to add new features to make a software great — just revisiting a design can add value. For INTViewer, the CRS selection dialog is one of the areas we improved just by tweaking the design.
Microsoft Azure + INTViewer
The cloud is not just a set of computing resources hosting web based-applications. Microsoft Azure can also be used to host what we know today as desktop PCs. Constant availability and unlimited storage are just two of the numerous advantages of hosting your PC on the cloud.
Simple Usability Features for Desktop Applications
Microsoft Windows has a standard dialog to choose and save files, but this is not an optimal way to navigate your file system from within your application. INTViewer addresses this issue.
Introducing the Normalization Widget
The Normalization widget is one of the new tools in INTViewer 5.2. It shows graphically how your current selection relates to the minimum and maximum amplitudes of the entire dataset. There are several normalization options in INTViewer: RMS, Maximum, Limits, etc.