Discover the Future of Subsurface Data Visualization
INT helps energy professionals, geoscientists, engineers and data scientists explore and analyze their subsurface data. Our visual libraries and platform transform the way people interact with their scientific data to make operational decisions in the energy industry. See why companies trust INT technology to power their digital transformation.
KEY SOLUTIONS FOR ENERGY DATA VISUALIZATION
Energy workflows in real-time, drilling, data management, machine learning, and much more require unique data visualization features, performance levels, and/or user interactions. This is why INT Technology offers 4 tailored solutions:

Energy Data with Powerful Insights
Track, monitor, and analyze the performance of your renewable energy assets with IVAAP.
LEARN MORE
See Your Data from Anywhere in Real Time
Identify problems early on and avoid costly disruptions with IVAAP’s real-time data visualization.
LEARN MORE

Upstream Advanced Visualization
Embed high-quality visualization components in your application, with minimal code.
LEARN MORE
Visualization for The OSDU Data Platform
Streamline access to and liberate data with powerful interoperability on the OSDU Data Platform.
LEARN MORE
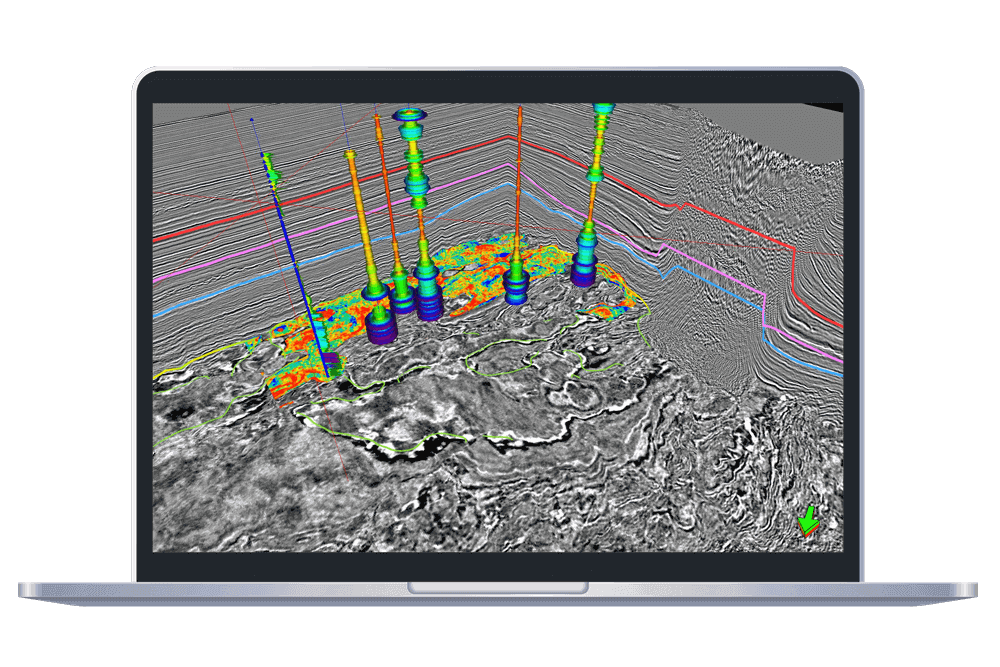
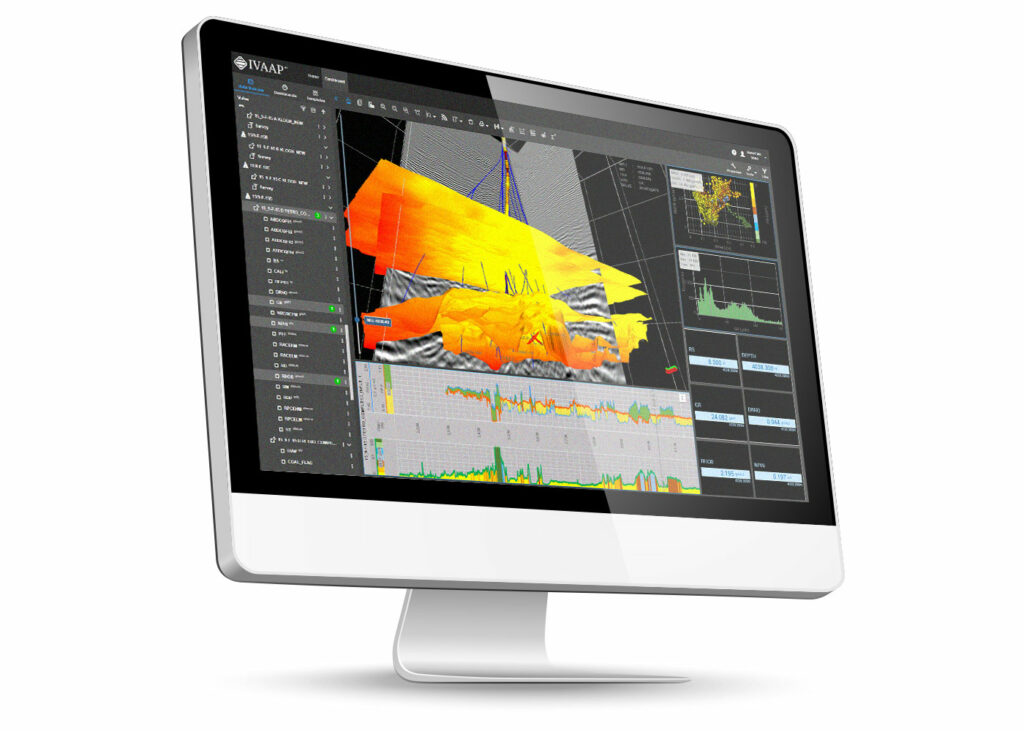
Enrich Your Digital Applications with Powerful Energy Data Visualizations
By embedding GeoToolkit and/or IVAAP Components, you can augment your workflow with rich data interaction in 2D and 3D for well logs, seismic, contour, schematics, crossplots, BHAs, maps, real-time data displays, and more.
LEARN MORE
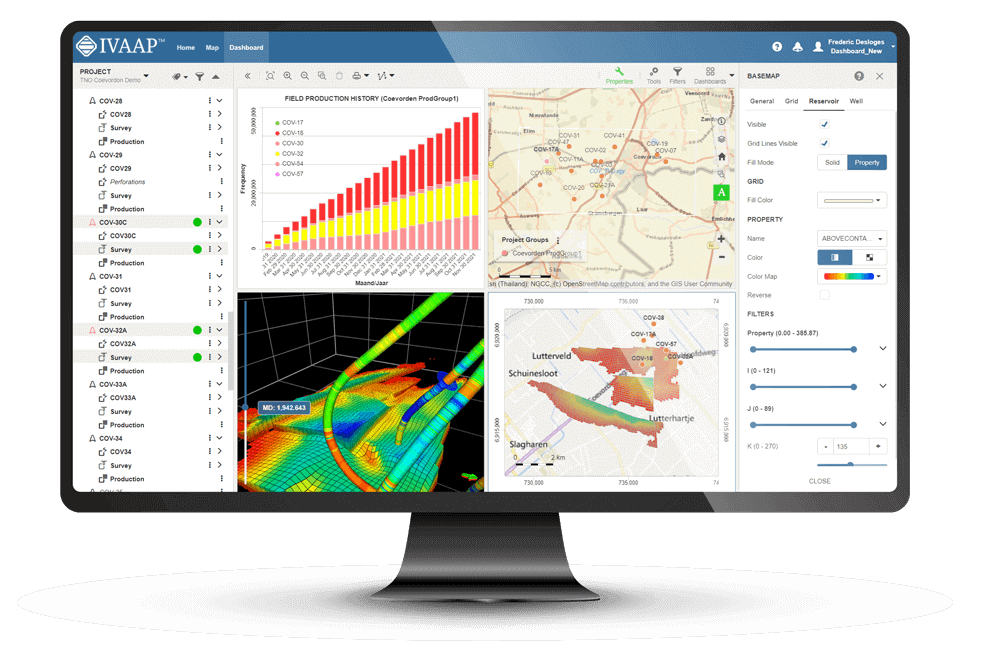
Give Context to Subsurface Data and Access to Data Science in a Single UI
By leveraging IVAAP Workflow integration connectors, your data science, which is spread across other systems, becomes accessible from your data cloud portal in the same place where you search, interact with, and visualize it.
LEARN MORE
Accelerate Customization and Development of Digital Energy Applications
The use of INT’s advanced data visualization technology significantly reduces time to deliver these capabilities in a cloud application. Developers can take advantage of extensive built-in high-performance features, customize client visuals, create new widgets, and add new data connectors by leveraging a rich set of APIs combined with a powerful SDK.
LEARN MORE
Not sure which solution is right?
Talk to our team to explore your goals and select the right software to fit your needs, budget, and goals.

Translate Your Data into Insights
Whether your team is fully remote or working together across the globe, INT can help you share, shape, and deliver real insights for your business, no matter the industry. See how we can help you deliver, fast >Watch How You Can Use IVAAP Advanced Visualization to Search, Access, and Display Subsurface Data in the Cloud
Request a DemoFEATURED RESOURCES
GeoToolkit.JS 2024 Features Map
GeoToolkit Java 3.9 Features Map
INTViewer 2023.1 Features Map
Explore our interactive demo gallery.
Try for freeUPCOMING NEWS & EVENTS

SLB Acquires INT, Expanding Its Data Visualization Capabilities Globally
INT Announces IVAAP 2024 Release
INT at SLB Digital Forum 2024, Monaco
INT Products
The World’s Leading Energy Companies Trust INT