• Skip to main content
  • Skip to footer

INT

Empowering Visualization

CONTACT US SUPPORT
MENUMENU
  • Products
    • Overview
    • IVAAP™
    • INTViewer™
    • GeoToolkit™
    • Product Overview
  • Demos
    • GeoToolkit Demos
    • IVAAP Demos
  • Success Stories
  • Solutions
    • Overview
    • For E&P
    • For OSDU Visualization
    • For Cloud Partners
    • For Machine Learning
    • For CCUS
    • For Geothermal Energy
    • For Wind Energy
    • For Enterprise
    • Tools for Developers
    • Services Overview
  • Resources
    • Blog
    • Developer Community
    • FAQ
    • INT Resources Library
  • About
    • Overview
    • News
    • Events
    • Careers
    • Meet Our Team
    • About INT

seismic

Jan 07 2022

INT Advances IVAAP as Universal Subsurface Cloud Viewer with Full OSDU™ Data Platform Support

Empower energy users’ experience by embedding advanced subsurface data visualization with your data science in your digital solutions.

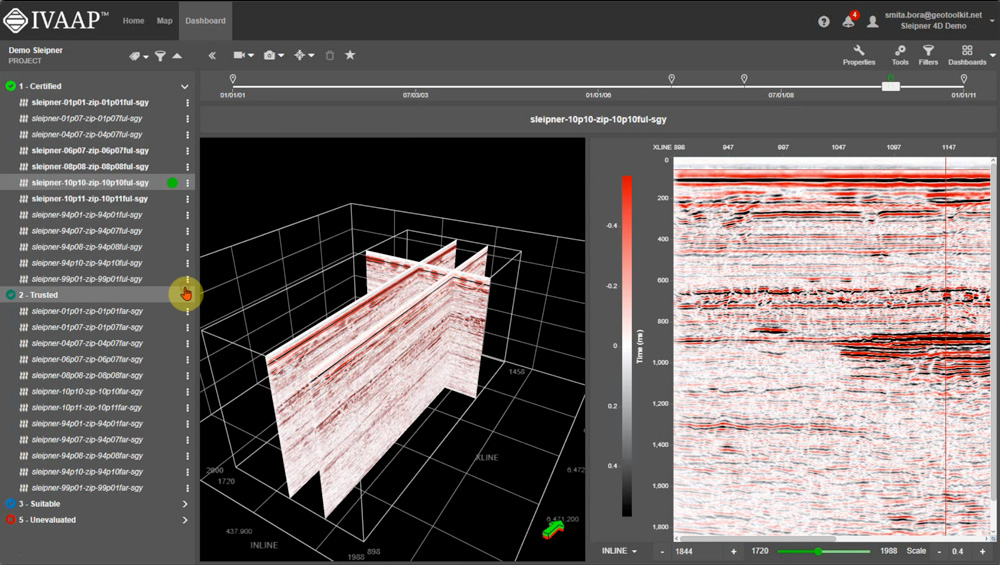
INT, a leading provider of data visualization software, just announced the newest version of their universal subsurface visualization and analytics application platform, IVAAP™. Offering full OSDU Data Platform support, IVAAP 2.9 enables exploration, visualization, and computation of energy data. The new release also expands IVAAP’s map-based search, data discovery, and data selection with 3D seismic volume intersection, 2D seismic overlays, reservoir, and basemap widgets to visualize all energy data types in the cloud.

As an OSDU-native application, IVAAP can accelerate the integration between the OSDU Data Platform and other EDM platforms. For example, INT recently partnered with Halliburton Landmark to demonstrate the power of interoperability between systems — linking IVAAP to Landmark EDM through the OSDU Data Platform on AWS. 

A major new feature of IVAAP is its integration capabilities with processing or machine learning services. This new capability was added in response to many energy companies who had many algorithms and models in various programs — Python, TensorFlow, Jupyter notebooks, to name a few — spread across the organization and were faced with the challenge to share them and make them accessible in other apps. With this new capability, IVAAP accelerates workflow integration and simplifies Machine Learning Operations (MLOps). 


“We’ve been working to fully integrate new features in IVAAP that can streamline user workflows, reducing time to decision and empowering users with data visualization to help them to collaborate, make strong, accurate business decisions, and otherwise improve their ability to work with subsurface data for energy,” said Olivier Lhemann, president of INT. “With this release, we bring that full circle — users can now access their data using the power of the OSDU Data Platform, perform machine learning and processing models, and visualize the results.”


IVAAP’s workflow integration opens up a brand new user experience where now data scientists, modelers, geophysicists, and data managers can search data in the cloud, select data of interest, and launch computation from a single platform. IVAAP is providing new ways for operators, services, and energy technology software providers to enrich their digital solutions with powerful visualization and integration capabilities to OSDU Data Platform and machine learning for further automation. 

Learn more about IVAAP at int.com/ivaap.

For more information, please visit www.int.com or contact us at intinfo@int.com.


Filed Under: IVAAP Tagged With: 3D, basemap, ivaap, machine learning, ml, OSDU, seismic, workflows

Apr 15 2021

INT to leverage IBM, Red Hat Open Technologies to Enhance Efficiencies in Oil & Gas Exploration and Drilling Workflows

The latest version of INT’s data visualization platform, IVAAP, integrates with IBM Open Data for Industries, IBM’s hybrid cloud implementation of the Open Group OSDU data.

HOUSTON, TX — April 15, 2021 — INT today announced that IVAAP — a leading enterprise subsurface data visualization platform — integrates with IBM Open Data for Industries for Cloud Pak for Data built on Red Hat OpenShift. These open technologies will enable the upstream industry to visualize exploration and drilling data across hybrid cloud environments to drive efficiencies and speed decision making.

As the oil and gas industry undergoes unparalleled transformation, members of the value chain are seeking solutions to maximize digital opportunities across their operations. Data is a critical asset and when leveraged with artificial intelligence, can yield mission-critical insights and competitive advantage.  However, quite often, domain-specific data exists in silos — limiting workflow efficiencies that leverage data insights for real-time decision-making.

Today’s announcement focuses on open technologies for the IVAAP platform that remove these barriers:

  • IVAAP leverages IBM Open Data for Industries for IBM Cloud Pak for Data, a data platform enabling seamless integration of data sources with the flexibility to deploy across any infrastructure that leverages The Open Group OSDU Forum data standard. The Open Group OSDU Forum is an industry organization that brings together technology leaders, producers and members of the oil and gas value chain to build a data foundation based on data standards making subsurface data easier to find, combine, and use across geoscience workflows.
  • IVAAP integrates with IBM Open Data for Industries for IBM Cloud Pak for Data powered by Red Hat OpenShift, the industry’s leading open source Kubernetes platform. This will enable INT customers to run IVAAP on-premise, unlocking speed and agility for local operations as well as remote locations through the cloud, yet all with one consistent architecture. This provides upstream operators greater value and flexibility for real-time operational decision-making, as well as consistency to the enterprise operations.

“We are extremely excited about the work we are engaging in with The Open Group OSDUTM Forum and our collaboration with IBM. For clients who manage hybrid cloud environments, our goal is to bring the technology to where they need it — in the cloud and in their locally hosted environment.”

— Olivier Lhemann, President of INT.


“Our collaboration with INT enables choice and flexibility in deploying subsurface data visualization across hybrid cloud environments. By leveraging IBM Open Data for Industries for IBM Cloud Pak for Data, INT and the oil and gas community can leverage an enterprise-grade, open-source platform based on the OSDU data foundation, improving access to subsurface data across any infrastructure, including public cloud, local country cloud and on-prem,” says Dariusz Piotrowski, Global Solutions Leader,
IBM Industrial Sector.

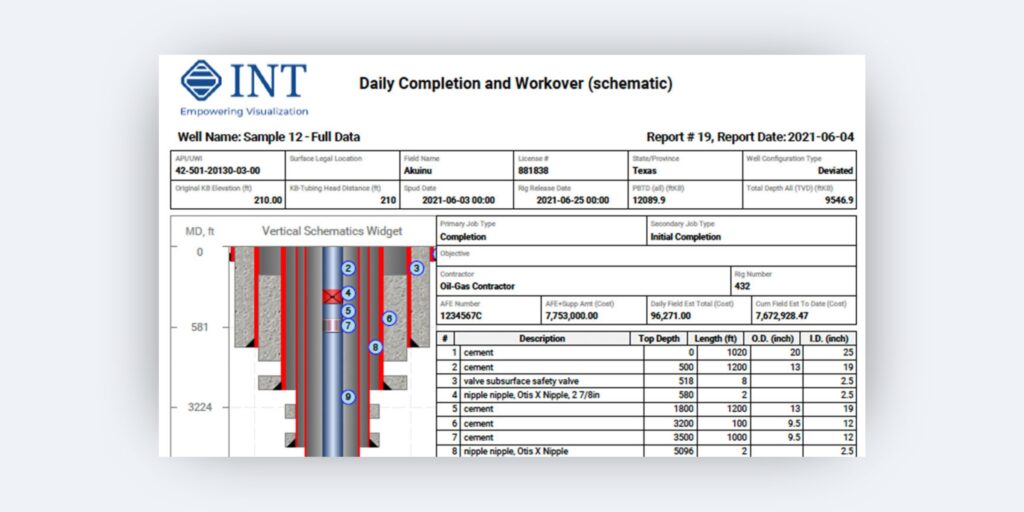
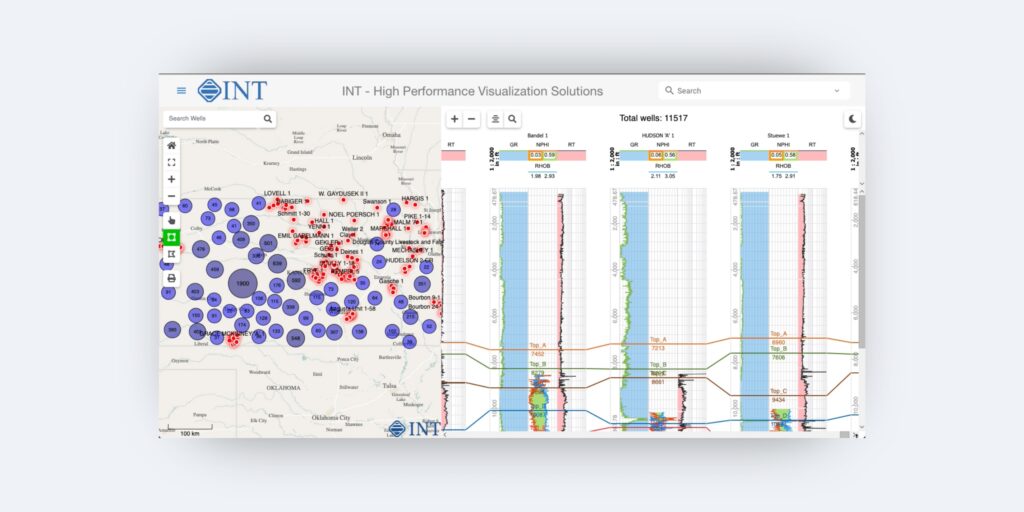
IVAAP is a sophisticated domain visualization and analytics platform that provides central access to data regardless of where it is — stored in the cloud and on-premise. Users can access, view, search, visualize, and analyze their subsurface data — wellbore, seismic, schematics, log, and more — in a web browser.

About INT:

INT software empowers the largest Oil & Gas (IOC/NOC) and services companies in the world to visualize their complex subsurface data (seismic, well log, reservoir, and schematics in 2D/3D). INT offers a visualization platform (IVAAP) and libraries (GeoToolkit) developers can use with their data ecosystem to deliver subsurface solutions (Exploration, Drilling, Production). INT’s powerful HTML5/JavaScript technology can be used for data aggregation, API services, high-performance visualization of G&G and petrophysical data in a browser. INT simplifies complex subsurface data visualization.

Read the press release on PRWeb.

For more information about IVAAP or INT’s other data visualization products, please visit https://www.int.com.

INT, the INT logo, and IVAAP are trademarks of Interactive Network Technologies, Inc., in the United States and/or other countries.

Red Hat, the Red Hat logo and OpenShift are trademarks or registered trademarks of Red Hat, Inc. or its subsidiaries in the U.S. and other countries.


Filed Under: IVAAP, Press Release Tagged With: IBM, ivaap, log, OSDU, schematics, seismic, subsurface data visualization, wellbore

Apr 08 2021

Extended Well Data: How to Use the New Well Data Structure in INTViewer 2021

LAS format is the industry-standard format to store and exchange well log curve data. Despite its simplicity and usability, it has some strong limitations: log curves must have the same Z sampling for instance.

The latest INTViewer 2021 introduces a new well data structure, the Extended Well Data (EWD). Like the existing well data based on LAS files, EWD can be displayed in the Well Log Window. They can be displayed in Map views, 3D, and seismic viewers as well (provided the trajectory is well defined). 

This new format allows more complex edition operation, heterogeneous log curves in the same well data, and a new time/depth conversion process. 

Synthesis Window

The EWD structure allows more flexibility in log and well edition. The EWD Synthesis window exhibits all logs and well metadata.

Extended Well Data Synthesis

On this window some actions are available:

  • Metadata edition
  • Add curves with formula
  • Remove curves
  • Open Well Log Window with selected curves

Curve data can be edited using the Log Curve editor.

log-curve

Z and values can be edited, samples can be added or removed, and data can be copied in an external spreadsheet, then pasted back in the editor after modification.

Contrary to standard LAS data, EWD allows log curves to have heterogeneous Z columns, and various samples count. Each log curve can then be edited individually without affecting other curves sampling.

To learn more about how to edit wells in INTViewer, check out our video tutorial:


Log Curve Formula

Like with standard LAS-based well data, curves can be added using a formula. Since log curves can have different Z units, users will be forbidden to mix time and depth curves using formulas.

Log Curve Formula

Since curves can be edited individually and have different sampling, the result curve, and all other curves used as input, will be resampled to the sampling of the first data found in the formula (in the image above GR_Time will be used).

Formula editor can be started from the main synthesis window, and also from the popup menu on the EWD node.

Time / Depth Conversion

By defining a curve as Time / Depth law (typically a curve that will have time or depth unit for data values, and opposite unit for Z values), EWD offers the ability to perform Time/Depth conversion. A simple editor to choose the data to convert and the law to use is opened when Time Depth conversion action is launched:

Time Depth Conversion


Time / Depth conversion can be performed on logs, but also on Markers. The EWD format can hold several Markers set, each having time or depth unit.

markers


Time/Depth conversion action can be found on the main EWD synthesis window, but it’s also available from the EWD contextual menu in Well Log Window.

The Time/Depth conversion process is a simple sample-by-sample linear interpolation using the Time/Depth law as reference. A more complex process, eventually with parameters, can be added with customization.

LAS Import/Export

EWD can be created from LAS files and exported to LAS files after edition. LAS data can then be imported as EWD in INTViewer 2021. Users can perform various editions, time/depth conversion, and other actions, then export the result in standard LAS to use the data outside INTViewer 2021. 

Export EWD to LAS

When exporting to LAS, the data domain must be specified (a LAS can only contain data sharing the same Z unit). Users can also choose which data to export. The following screenshot shows an EWD data and the exported LAS side by side. 

In the EWD view log curves and markers are in depth, the time depth law is displayed in green. Converted and exported data are in time.

INTViewer 2021 SS

Users have the choice with EWD to display or not in the same view time and depth data. 

Customization

The Extended Well Data GUIs can be customized to offer more specific behaviour to the standard EWD functionalities. So a specific plugin will be able to modify:

  • EWD Synthesis customization 
    • Specific header panel 
    • Custom table filters
    • Custom table control (available units, domain, validation)
  • Time/Depth conversion
    • Conversion process and parameters can be added

For more information on INTViewer, please visit www.int.com/products/intviewer/


Filed Under: INTViewer Tagged With: 3D, Extended Well Data, INTViewer, maps, seismic

Nov 06 2020

How to Get the Best Performance out of Your Seismic Web Applications

One of the most challenging data management problems faced in the industry is with seismic files. Some oil and gas companies estimate that they acquire a petabyte of data per day or more. Domain knowledge and specific approaches are required to move, access, and visualize that data.

In this blog post, we will dive deep into the details of modern technology that can be useful to achieve speed up. We will also cover: common challenges around seismic visualization, how INT helps solve these challenges with advanced compression and decompression techniques, how INT uses vectorization to speed up compression, and more.

What Is IVAAP?

IVAAP is a data visualization platform that accelerates the delivery of cloud-enabled geoscience, drilling, and production solutions.

  • IVAAP Client offers flexible dashboards, 2D & 3D widgets, sessions, and templates
  • IVAAP Server side connects to multiple data sources, integrates with your workflows, and offers real-time services
  • IVAAP Admin client manages user access and projects

Screen Shot 2020-11-04 at 2.37.45 PM


Server – Client Interaction

Interaction occurs when the client requests a file to display from the server, the server returns the file lists, the user chooses a file to display, and then the server starts sending chunks of data while it displays this data.

Screen Shot 2020-11-04 at 2.42.21 PM

Some issues encountered with this scheme include:

  • Seismic data files are huge in size — they can be hundreds of gigabytes or even terabytes.
  • Because of the file size, it takes too much time to transfer files via network.
  • The network can have too much bandwidth.

The goals of this scheme are to:

  • Speed up file transfer time
  • Reduce data size for transfer
  • Add user controls for different network bandwidth

And the solution:

  • We decided to implement server-side compression and client-side decompression. We also decided to provide the client parameter that we call acceptable error level after the seismic data file compression/decompression process.

Screen Shot 2020-11-04 at 2.43.13 PM


By taking a closer look at compression and decompression data, we can see that the original seismic data goes through a set of five transformations — AGC, Normalization, Hear Wavelets, Quantization, and Huffman. As a result of this transformation, we get a compressed file that can be sent to clients via network. And on the client’s side, there is a decompression process that goes in different directions — from inverse Huffman to inverse AGC. This is the way that clients get original data. It does not get precise, original data. But it gets data after the compression and decompression process. That’s why we added an acceptable error level after the compression and decompression process. This is because we have different scenarios where clients don’t always require the full original data with the full level of precision. For example, sometimes the client only needs to review the seismic data. So using this acceptable error level, they can control how much data will be passed by a network and, of course, speed up this process. 

The resulting scheme looks like this:

Screen Shot 2020-11-04 at 2.44.32 PM


The client requests a file list from the server, the user chooses a file to display, and then the server starts sending the data and compresses it. The server then sends it to the client, the client decompresses, and finally, it displays the data. This is repeated for each tile to display.

So why not use any other existing compression, like GZIP, LZ Deflate, etc.? We tried these compressions, but we found out that this type of compression is not as effective as we’d like it to be on our seismic data.

Server-Side Interaction

The primary objective was to speed up the current implementation of compression and decompression on both the server and client side.

The proposal:

  • Server-side compression is implemented in Java, so we decided to create C++ implementation of compression sequence and use JNI layer to call native methods. For the client-side decompression, we implemented in JavaScript to create C++ implementation of decompression and use WebAssembly (WASM) proposal for integrating C++ code into JS.
  • We implemented both compression and decompression algorithms in C++, but after comparing the results and performance of C++ and Java, we discovered that C++ was just 1.5 times faster than “warmed up JVM”. That’s why we decided to move on and apply SIMD instructions for further speedup.

Single Instruction Multiple Data (SIMD)

Screen Shot 2020-11-04 at 2.51.30 PM

SIMD architecture performs the same operation on multiple data elements in parallel. For Scalar operation, you have to perform four separate calculations to get the right result. For SIMD operations, you apply one vector value calculation to get the correct result.

SIMD benefits:

  • Allows processing of several data values with one single instruction.
  • Much faster computation on predefined computation patterns.

SIMD drawbacks:

  • SIMD operations cannot be used to process multiple data in different ways.
  • SIMD operations can only be applied to predefined processing patterns with independent data handling.

Normalization: C++ scalar implementation

Screen Shot 2020-11-04 at 2.47.45 PM

Normalization: C++ SIMD SSE implementation

Screen Shot 2020-11-04 at 2.48.09 PM

Server-Side Speedup Results

There are different types of speedup for different algorithms:

  • Normalization is 9 times faster than the scalar C++ version
  • Haar Wavelets is 6 times faster than the scalar C++ version
  • Huffman has no performance increase (not vectorizable algorithm)

Overall, the server-side compression performance improvement is around 3 times faster than the Java version. This is applying SIMD C++ code. This was good for us, so we decided to move on to the client-side speedup.

Client-Side Speedup

For the client-side speedup, we implemented decompression algorithms in C++ and used WASM to integrate the C++ code in JavaScript.

WebAssembly

WASM is:

  • A binary executable format that can run in browsers
  • A low-level virtual machine
  • A high-level language compile result

WASM is not: 

  • A programming language
  • Connected to the web and cannot be run outside the web

Steps to get WASM working:

Screen Shot 2020-11-04 at 2.48.28 PM

  • Compile C/C++ code with Emscripten to obtain a WASM binary
  • Bind WASM binary to the page using a JavaScript “glue code” 
  • Run app and let the browser instantiate the WASM module, the memory, and the table of references. Once that is done, the WebApp is fully operative. 

C++ Code to Integrate (TaperFilter.h/cpp)

Screen Shot 2020-11-04 at 2.48.55 PM

Emscripten Bindings 

Screen Shot 2020-11-04 at 2.49.12 PM

WebAssembly Integration Example

Screen Shot 2020-11-04 at 2.51.30 PM

Client-Side Speedup Takeaways:

  • Emscripten supports the WebAssembly SIMD proposal
  • Vectorized code will be executed by browsers
  • The results of vectorization for decompression algorithm are: 
    • Inv Normalization: 6 times speedup
    • Inv Haar Wavelets: 10 times speedup
    • Inv Huffman: no performance improvement (not vectorizable)

Overall, the client-side decompression performance improvement with vectorized C++ code was around 6 times faster than the JavaScript version.

For more information on GeoToolkit, please visit int.com/geotoolkit/ or check out our webinar, “How to Get the Best Performance of Your Seismic Web Applications.”


Filed Under: IVAAP Tagged With: compression, ivaap, java, javascript, seismic

Sep 09 2020

INT Adds Client SDK and Improves Seismic and Subsurface Visualization Performance with Latest Release of IVAAP 2.6

This release confirms IVAAP as a leader in the subsurface data visualization space, supporting Data Visualization and Data Management for Subsurface, Exploration, Drilling, or Production Applications in the cloud.

Houston, TX — INT is pleased to announce the newest release of its HTML5 upstream visualization platform, IVAAP™ 2.6, accelerating the pace of our release cycle to respond faster to the growing needs of our clients and partners.

IVAAP now offers a robust client SDK so users can extend the platform to meet their unique business objectives — now users can write new and extend existing widgets; add or remove existing modules; create new data connectors; extend the data model; and more. 

IVAAP 2.6 offers several key enhancements that mean better performance and faster data interaction in the cloud (Azure, AWS, Google): more interpretation capabilities with added fault picking in 2D seismic; improved map-based search with multiple criteria for OSDU R2; UI and navigation improvements; support for real-time wireline logging with decreasing depth; and a new connector to the Energy Information Administration (EIA) database.

“For this latest release, we wanted to focus on features and improvements that would complement our partnership with OSDU and enhance our cloud offerings,” said Hugues Thevoux-Chabuel, Vice President, Cloud Solutions at INT. “We gathered feedback from developers and end users to better understand their needs and worked hard to ensure IVAAP exceeds the current and near-future demands of our clients.”

IVAAP is an upstream visualization platform that enables search and visualization of geophysical, petrophysical, and production data in the cloud. It allows product owners, developers, and architects to rapidly build next-level subsurface digital solutions anywhere without having to start from scratch. 

Read the press release on PRWeb >

Check out int.com/ivaap for a preview of IVAAP or for a demo of INT’s other data visualization products. 

For more information, please visit www.int.com or contact us at intinfo@int.com.

Filed Under: IVAAP, Press Release Tagged With: faults, ivaap, SDK, seismic

  • Go to page 1
  • Go to page 2
  • Go to Next Page »

Footer

Solutions

  • For E&P
  • For OSDU Visualization
  • For Cloud Partners
  • For Machine Learning
  • For CCUS
  • For Geothermal Energy
  • For Wind Energy
  • For Enterprise
  • Tools for Developers
  • Customer Success Stories

Products

  • IVAAP
  • GeoToolkit
  • INTViewer
  • IVAAP Demos
  • GeoToolkit Demos

About

  • News
  • Events
  • Careers
  • Management Team

Resources

  • Blog
  • FAQ

Support

  • JIRA
  • Developer Community

Contact

INT logo
© 1989–2023 Interactive Network Technologies, Inc.
Privacy Policy
  • Careers
  • Contact Us
  • Search

COPYRIGHT © 2023 INTERACTIVE NETWORK TECHNOLOGIES, Inc