• Skip to main content
  • Skip to footer

INT

Empowering Visualization

CONTACT US SUPPORT
MENUMENU
  • Products
    • Overview
    • IVAAP™
    • INTViewer™
    • GeoToolkit™
    • Product Overview
  • Demos
    • GeoToolkit Demos
    • IVAAP Demos
  • Success Stories
  • Solutions
    • Overview
    • For E&P
    • For OSDU Visualization
    • For Cloud Partners
    • For Machine Learning
    • For CCUS
    • For Geothermal Energy
    • For Wind Energy
    • For Enterprise
    • Tools for Developers
    • Services Overview
  • Resources
    • Blog
    • Developer Community
    • FAQ
    • INT Resources Library
  • About
    • Overview
    • News
    • Events
    • Careers
    • Meet Our Team
    • About INT

machine learning

Jan 07 2022

INT Advances IVAAP as Universal Subsurface Cloud Viewer with Full OSDU™ Data Platform Support

Empower energy users’ experience by embedding advanced subsurface data visualization with your data science in your digital solutions.

INT, a leading provider of data visualization software, just announced the newest version of their universal subsurface visualization and analytics application platform, IVAAP™. Offering full OSDU Data Platform support, IVAAP 2.9 enables exploration, visualization, and computation of energy data. The new release also expands IVAAP’s map-based search, data discovery, and data selection with 3D seismic volume intersection, 2D seismic overlays, reservoir, and basemap widgets to visualize all energy data types in the cloud.

As an OSDU-native application, IVAAP can accelerate the integration between the OSDU Data Platform and other EDM platforms. For example, INT recently partnered with Halliburton Landmark to demonstrate the power of interoperability between systems — linking IVAAP to Landmark EDM through the OSDU Data Platform on AWS. 

A major new feature of IVAAP is its integration capabilities with processing or machine learning services. This new capability was added in response to many energy companies who had many algorithms and models in various programs — Python, TensorFlow, Jupyter notebooks, to name a few — spread across the organization and were faced with the challenge to share them and make them accessible in other apps. With this new capability, IVAAP accelerates workflow integration and simplifies Machine Learning Operations (MLOps). 


“We’ve been working to fully integrate new features in IVAAP that can streamline user workflows, reducing time to decision and empowering users with data visualization to help them to collaborate, make strong, accurate business decisions, and otherwise improve their ability to work with subsurface data for energy,” said Olivier Lhemann, president of INT. “With this release, we bring that full circle — users can now access their data using the power of the OSDU Data Platform, perform machine learning and processing models, and visualize the results.”


IVAAP’s workflow integration opens up a brand new user experience where now data scientists, modelers, geophysicists, and data managers can search data in the cloud, select data of interest, and launch computation from a single platform. IVAAP is providing new ways for operators, services, and energy technology software providers to enrich their digital solutions with powerful visualization and integration capabilities to OSDU Data Platform and machine learning for further automation. 

Learn more about IVAAP at int.com/ivaap.

For more information, please visit www.int.com or contact us at intinfo@int.com.

Filed Under: IVAAP Tagged With: 3D, basemap, ivaap, machine learning, ml, OSDU, seismic, workflows

Jul 29 2021

Intel OpenVino and IBM Red Hat Select IVAAP to Demonstrate the Power of New Hybrid Cloud OSDU Data Platform

This offering powers a unified environment to drive AI, accelerated data analytics, and high-performance computing (HPC) integrated with IVAAP Data Visualization platform.

IBM and Red Hat joined forces to deliver the only market-ready hybrid cloud implementation of the OSDU Data Platform. Additionally, Intel, IBM, and Red Hat are teaming up to deliver a fully hybrid cloud-to-edge OSDU-enabled industry offering to power a unified environment to drive AI, accelerated data analytics, and high-performance computing (HPC). By leveraging Intel’s AI-optimized Xeon Processors with the Intel Open Visual Inference and Neural Network Optimization (OpenVINO) toolkit, operators can benefit from Intel’s performance optimizations built for OpenShift and IBM Cloud Pak for Data.

The OpenVINO toolkit helps optimize computer vision inference models that use artificial intelligence and machine learning (AI/ML) on Intel platforms. It focuses on models that have already been trained, and applies capabilities learned after training a neural network to yield results. The Intel distribution of the OpenVINO toolkit enables the optimization, tuning, and running of comprehensive AI inference using the included model optimizer and runtime and
development tools.

Bringing to Life OSDU Seismic Interpretation Workflows from Intel/IBM Red Hat with IVAAP: A Demonstration on Salt and Fault Detection

Seismic interpretation—the tedious manual task of picking faults and horizons within sections to ultimately build an earth model that identifies proven hydrocarbons—is undergoing a fundamental shift. The application of AI/ML to uncover hidden patterns and correlations enables geoscientists to gain visibility into complex relationships between geologic features and seismic data. Because artificial neural networks learn by example and can solve problems with diverse, unstructured and interconnected data, deep learning (a subfield of ML) is an exciting technology for seismic interpretation.

As an example of the power of IBM Open Data for Industries, Intel and IBM have partnered with INT—a widely adopted oil and gas visualization software provider for more than 30 years—to deliver an end-to-end workflow using INT IVAAP for upstream data visualization.

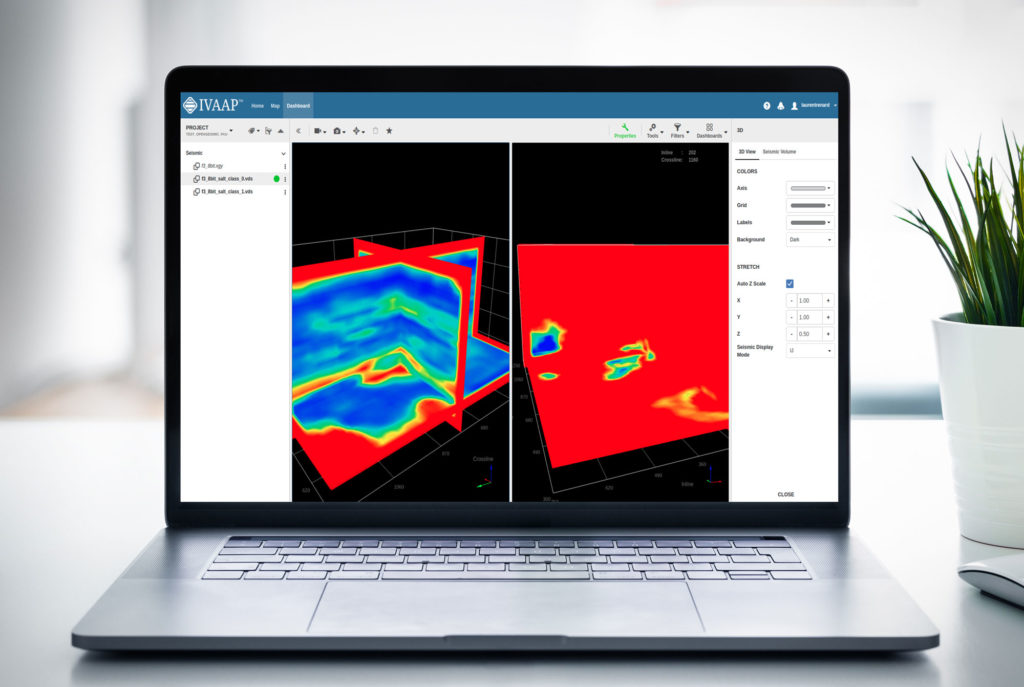
IVAAP OpenSeismic salt dome formation

Thanks to its hybrid cloud foundations, this implementation of the OSDU Data Platform can easily be applied as a supervised deep learning approach to locating subsurface features, such as a salt dome. Deploying an optimized model generated from OpenVINO on the platform can accelerate the end-to-end seismic interpretation workflow.

In this example, the data was visualized using INT’s IVAAP to locate the seismic information by navigating through the IVAAP geospatial interface. Once the data is selected in the IVAAP project, it can easily be retrieved within the OSDU delivery API for use in a Jupyter Notebook where the OpenVINO libraries are available.

The seismic inference workflow integrates INT IVAAP visualization for the selection of a data and AI model, and integrates to an IBM Open Data for Industries instance within a Jupyter Notebook for inference processing. The inference results and statistics can be viewed within IVAAP visualization for quality inspection and analysis. This complete AI inference workflow—from the data and model elections up to display of inference results—can be easily leveraged to other data types and inference models. In addition, it can be extended through to additional subsurface inference workloads from data QC to interpretation and extrapolation. IVAAP can also be used to visualize facies characterization, data classification, log prediction, and more.

3D_seismic-dualscreen_small

The Power of Collaboration—and a Robust Visualization Solution—in the Cloud

As IBM, Red Hat, and Intel have shown, collaborations are key to driving success of the OSDU Data Platform—their shared goal is to make edge computing and connected hybrid clouds more secure, open, and flexible with complete interoperability.

To make the most of these interconnected functionalities, you need a robust, cloud-based front-end visualization that works with the OSDU platform to consume that data, launch and execute machine learning workflows, and visualize the results, all in one platform in the cloud.

To learn more about how IVAAP supports machine learning, visit int.com/solutions/machine-learning/ or to learn more about INT’s partnership with IBM, check out our press release.

Filed Under: IVAAP Tagged With: ai, IBM, ivaap, machine learning, ml, OSDU, redhat

Jul 06 2021

Rethinking ML Integration to Deliver a User Experience with a True End-to-End Geoscience Workflow

For E&P companies, the next challenge in their digital transformation — once their data has been properly stored, indexed, enriched, and cataloged in the cloud — is to make it available in a collaborative way where users can easily interact with the data through exploration, computation, and analysis. To create this digital workspace, companies must fully integrate machine learning, along with advanced data visualization, in a single platform where users can search, select data from multiple data sources, execute models, and visualize the results.

Accelerating the Transition from R&D to Operations
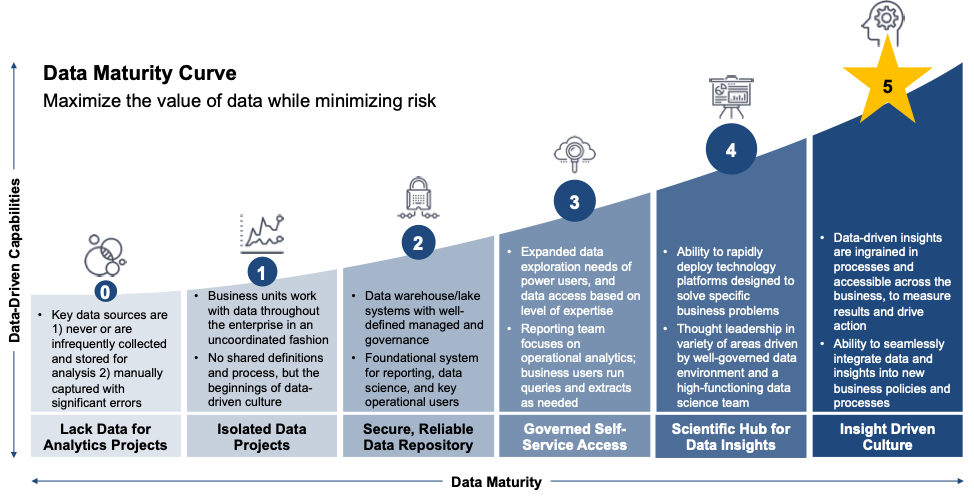
While many companies have begun the shift toward using machine learning, many have not seamlessly integrated ML. Implementing ML is the goal, but many get stuck along the way, weighed down by cumbersome processes or siloed systems. So the first challenge is transitioning the ML process from R&D to operations, where the model is fully deployed and used by data scientists.

ML-chart
Source: World Wide Technology


In a typical process, once the data is prepared and cleaned, it is split and labeled for training in order to understand whether the model is working properly or not. Then the model is moved into operations, data is fed into it, and finally, the user can see the output. The process from development to production, R&D to operations is very, very slow, even with continuous integration and deployment pipelines. This is where a centralized solution can help to eliminate the need to move data from one system to another or have to build another application to consume, compute, and visualize the data.

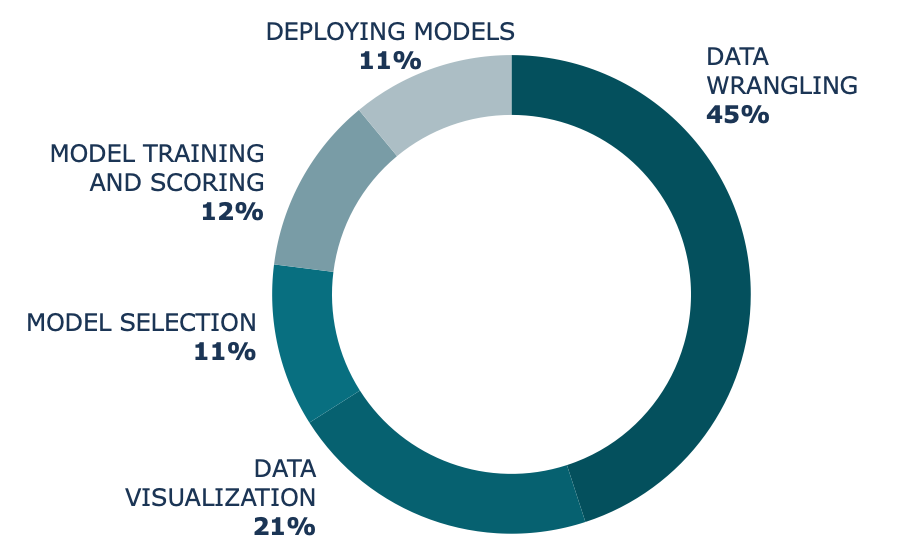
Screen Shot 2021-07-06 at 2.55.27 PM
SOURCE: State of Data Science 2020. Anaconda. www.anaconda.com/state-of-data-science-2020.

The Drivers for Centralizing Data Exploration, ML Execution, and Domain Visualization
Integrating machine learning into geoscience workflows has traditionally posed many challenges for data scientists, from siloed, incomplete data to disjointed, disconnected systems. Even now, once geoscientists spend up to 45% of their time ensuring that the data is uniform, organized, and labeled correctly, they must then switch to another application to execute the model, another to view the results, and yet another to share the results with their team. By combining these processes in one place, companies can get the most from their data — the most accurate models, with the most accurate business insights.


The Emergence of New Visualization Technologies Leveraging ML to Power Data-Driven Decisions
For true ML integration, companies are challenged to rethink the user experience and find a way to utilize a single platform that can simplify this process, from collecting and cleaning data to training and evaluating the model to using the model to power data-driven business decisions. This is why many companies are looking at “re-platforming” existing apps or simply rebuilding new apps that can combine features spread across multiple applications. However, companies do not need to go down that path anymore with the emergence of a new generation of data visualization cloud-native platforms such as IVAAP.

IVAAP is a new way to connect the dots. The cloud-native client is creating a single place for users such as geoscientists and data scientists to conduct all necessary steps in MLOps: data exploration, ML execution, and visualization. The platform offers a digital workspace connecting to the various back-end systems seamlessly for end-end users.

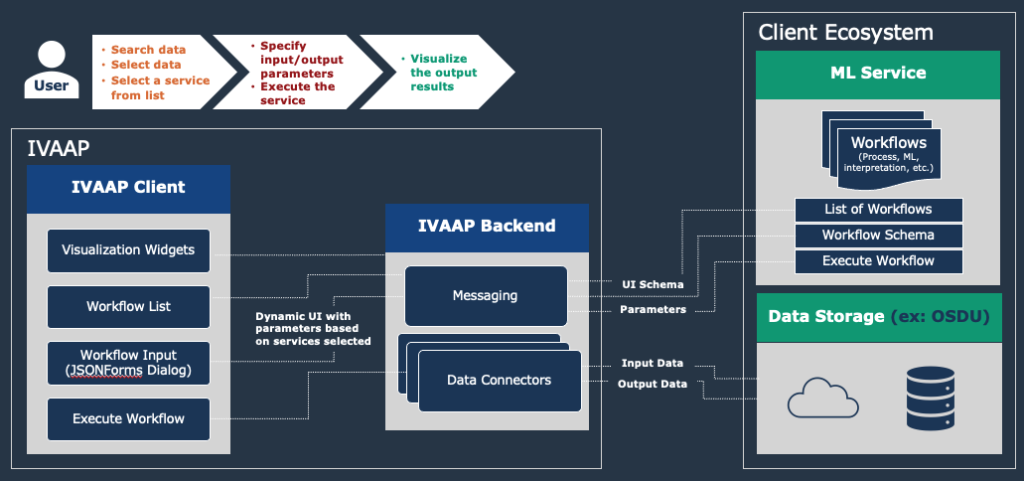
Screen Shot 2021-07-06 at 8.50.54 AM
INT’s IVAAP integrates with ML Service and Data Storage


In the example above, the user can access search functions, data sources, and various ML environments such as AWS SageMaker to create a true end-to-end machine learning integration. Streamlining and simplifying the geoscience workflow starts with the end-user experience: the user can be presented with specific data input/output dynamically based on the processing function or ML programs he is executing. IVAAP’s dynamic UI delivers a powerful way for data scientists to execute ML in geoscience.

If you are interested in learning more, you can also check out the recent AWS/INT webinar for a deeper dive into how the technology works, dynamic UI, and ML integration.

Learn more about IVAAP here or contact us at info@int.com.

Filed Under: IVAAP Tagged With: data visualization, ivaap, machine learning, streamline workflows

May 11 2021

IVAAP Data Visualization Platform Unlocks the Power of Energy Data with New Connector for Machine Learning and Processing Services

Rapidly connect IVAAP to ANY processing service or model to give end-users instant control over input/output, execution, and visualization of their data science.

Houston, TX — May 11, 2021 —INT is pleased to announce the newest release of its enterprise data visualization platform, IVAAP™ 2.8. This release includes new, game-changing machine learning capabilities utilizing IVAAP’s services-based architecture to quickly plug new processes and workflows into IVAAP’s data visualization admin. 

As energy companies are in the process of ingesting data and migrating to the cloud to empower search and work with their energy data, one key piece — leveraging machine learning and processing — becomes even more important to help them automate their workflows. 

IVAAP can now connect to any machine learning or processing service, allowing users to execute a complete, end-to-end workflow all in one platform. For data scientists, this means they can easily connect the dots — they can consume data, trigger and execute processing or machine learning models in a simple way, and visualize the results of their data science quickly. Once complete, the workflow can write the results back to the selected cloud storage and the output can be visualized instantly. 

Product owners can offer their end users a robust, web-based platform with a dynamic UI leveraging self-describing JSON technology to generate dialogs on the fly without a costly rebuild or time-intensive redeploy. These model dialogs mean users can select relevant data and parameters, start processing, and visualize the process output, all in one platform. 


“Machine learning and AI are at the forefront of the current data revolution, so it was important for us to explore and create new ways to interact with data science and deliver intuitive user experience that developers can easily build,” said Hugues Thevoux-Chabuel, Vice President, Cloud Solutions at INT. “Many of our clients have asked how to easily connect to their existing models and programs to consume their data without having these services hard-coded and difficult to invoke and maintain.”


This IVAAP release also features a new basemap widget, a reporting widget, improvements to IVAAP’s schematics display, including new 2D deviated schematics plus additional visualization in 3D, such as perforations, casing, casing shoe, and tubing. IVAAP supports integration with all major cloud providers — AWS, Microsoft Azure, Google Cloud Platform, and IBM — and supports on-premise installations. 

IVAAP is an upstream visualization platform that enables search and visualization of energy, geophysical and production data in the cloud. It allows product owners, developers, and architects to rapidly build next-level subsurface digital solutions anywhere without having to start from scratch. 

Read the press release on PRWeb.

For more information, please visit www.int.com or contact us at intinfo@int.com.

Visit us online at int.com/ivaap for a preview of IVAAP or for a demo of INT’s other data visualization products. 


____________

ABOUT INT:

INT software empowers the largest energy and services companies in the world to visualize their complex subsurface data (seismic, well log, reservoir, and schematics in 2D/3D). INT offers a visualization platform (IVAAP) and libraries (GeoToolkit) developers can use with their data ecosystem to deliver subsurface solutions (Exploration, Drilling, Production). INT’s powerful HTML5/JavaScript technology can be used for data aggregation, API services, and high-performance visualization of G&G and petrophysical data in a browser. INT simplifies complex subsurface data visualization.

For more information about IVAAP or INT’s other data visualization products, please visit https://www.int.com.

INT, the INT logo, and IVAAP are trademarks of Interactive Network Technologies, Inc., in the United States and/or other countries.
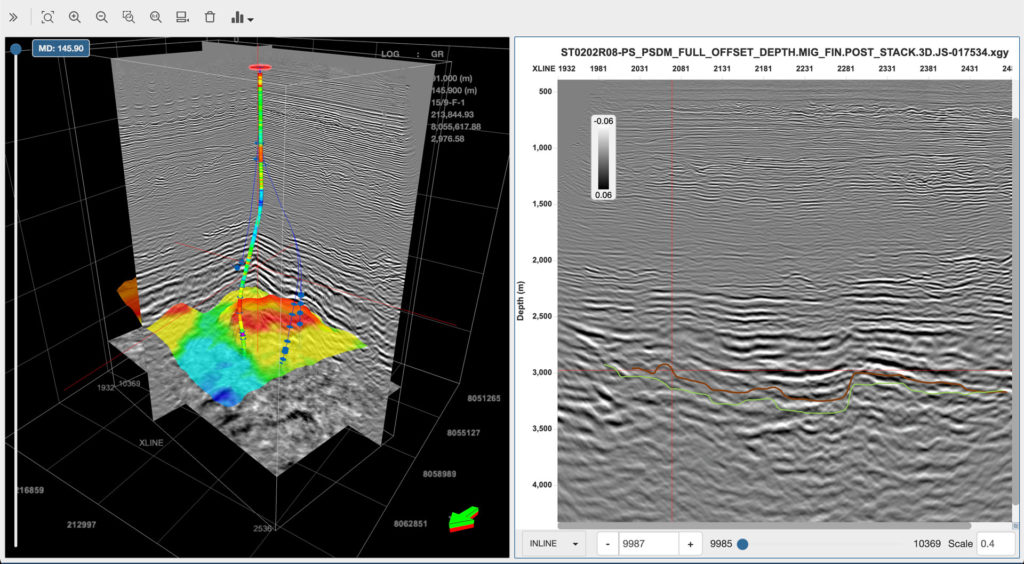
Filed Under: IVAAP, Press Release Tagged With: cloud, connector, energy, machine learning, subsurface data visualization

Footer

Solutions

  • For E&P
  • For OSDU Visualization
  • For Cloud Partners
  • For Machine Learning
  • For CCUS
  • For Geothermal Energy
  • For Wind Energy
  • For Enterprise
  • Tools for Developers
  • Customer Success Stories

Products

  • IVAAP
  • GeoToolkit
  • INTViewer
  • IVAAP Demos
  • GeoToolkit Demos

About

  • News
  • Events
  • Careers
  • Management Team

Resources

  • Blog
  • FAQ

Support

  • JIRA
  • Developer Community

Contact


© 1989–2022 Interactive Network Technologies, Inc.
Privacy Policy
  • Careers
  • Contact Us
  • Search

COPYRIGHT © 2022 INTERACTIVE NETWORK TECHNOLOGIES, Inc