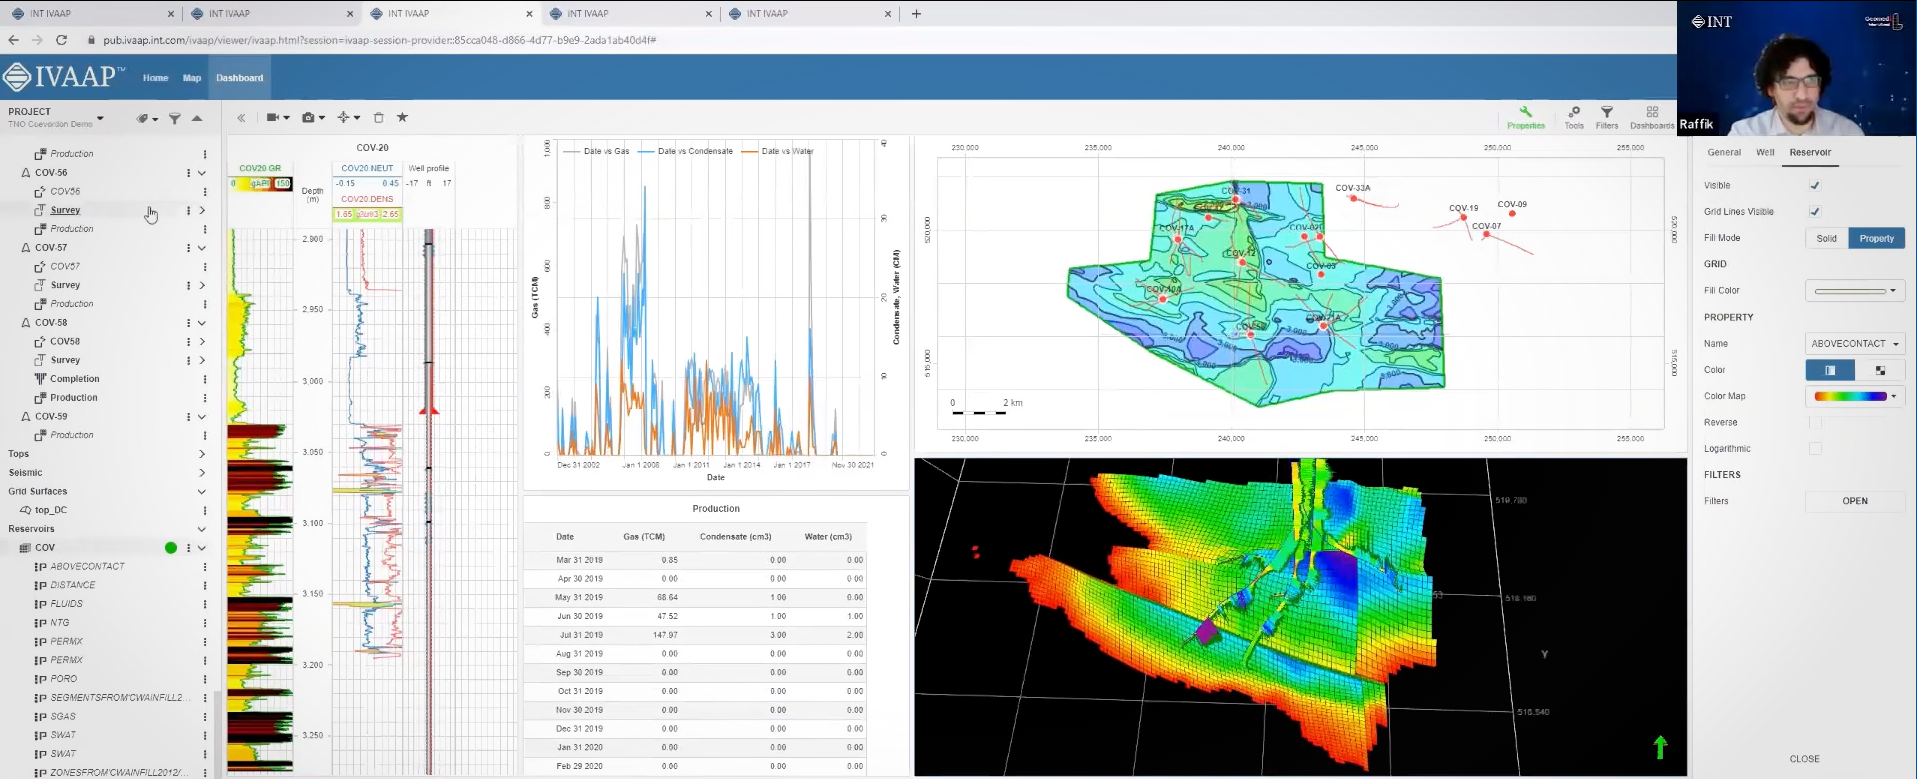
The latest release of IVAAP by INT introduces an array of exciting new features and enhancements, providing users with unparalleled capabilities to extract deeper insights from their subsurface data.
Houston, TX — August 10, 2023 — INT announced today the launch of IVAAP™ 2.11, the latest version of our Universal Cloud Data Visualization Platform. With powerful features and enhanced capabilities, IVAAP™ 2.11 takes subsurface data exploration and visualization to new heights, empowering users to make critical decisions with confidence and efficiency.
Some of the key highlights include:
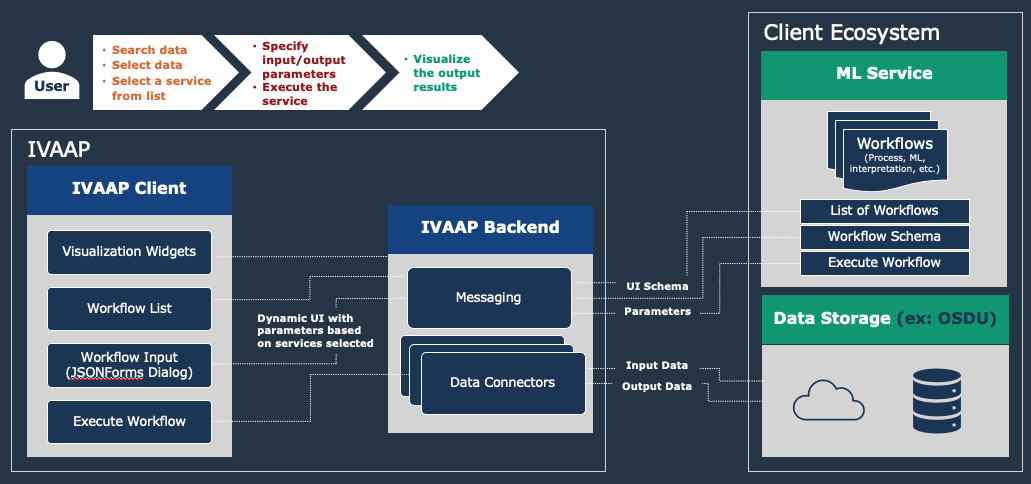
- External Workflows to Support Machine Learning and Data Processing: With IVAAP™ 2.11, users can now seamlessly integrate external processing workflows and ML capabilities, unlocking the true potential of their data through advanced analytics and data automation.
- Unit System Management: IVAAP™ introduces Unit System Management, offering users enhanced control over data consistency and clarity by efficiently managing unit conversions.
- WellLog Enhancements: WellLog module sees significant improvements, including support for stacked patterns curve, curve editing, lithology editing, and discrete raster files.
- Dynamic Range Intervals: Selected depth intervals can be highlighted in multiple widgets like cross-plot, pie charts, histograms, and more. Moving intervals along the depth are reflected automatically across all widgets.
- OSDU™ Data Platform Compatibility: IVAAP now offers full support for perforation intervals, stratigraphic columns, well-core images, hole sections, and collections on the OSDU Data Platform. Additionally, KPIs are now available on the IVAAP Home page.
“IVAAP 2.11 represents a significant milestone in our journey towards providing the oil and gas industry with the most advanced and comprehensive data visualization platform. With the introduction of external workflow support for machine learning and data processing and full compatibility with the OSDU Data Platform, IVAAP continues to empower geoscientists and engineers to explore, visualize, and automate their data like never before,” said Hugues Thevoux, VP of Cloud Solutions at INT. “This release underscores our commitment to delivering cutting-edge solutions that drive efficiency, foster innovation, and enable our clients to make smarter decisions with confidence.”
IVAAP 2.11 is now available for all existing users. To experience the power of IVAAP or to schedule a personalized demo, visit int.com/demo-gallery/ivaap/ or contact our sales team at intinfo@int.com.
To learn more about IVAAP 2.11, please visit int.com/products/ivaap/ or contact us at intinfo@int.com.
Read the IVAAP 2.11 Release Notes.
Read the press release on PRWeb.
____________
ABOUT IVAAP:
IVAAP™ is a Universal Cloud Data Visualization Platform where users can explore domain data, visualize 2D/3D G&G data (wells, seismic, horizons, surface), and perform data automation by integrating with external processing workflows and ML.
ABOUT INT:
INT software empowers the largest energy and services companies in the world to visualize their complex subsurface data (seismic, well log, reservoir, and schematics in 2D/3D). INT offers a visualization platform (IVAAP) and libraries (GeoToolkit) developers can use with their data ecosystem to deliver subsurface solutions (Exploration, Drilling, Production). INT’s powerful HTML5/JavaScript technology can be used for data aggregation, API services, and high-performance visualization of G&G and petrophysical data in a browser. INT simplifies complex subsurface data visualization.
For more information about IVAAP or INT’s other data visualization products, please visit https://www.int.com.
INT, the INT logo, and GeoToolkit are trademarks of Interactive Network Technologies, Inc., in the United States and/or other countries.