LAS format is the industry-standard format to store and exchange well log curve data. Despite its simplicity and usability, it has some strong limitations: log curves must have the same Z sampling for instance.
The latest INTViewer 2021 introduces a new well data structure, the Extended Well Data (EWD). Like the existing well data based on LAS files, EWD can be displayed in the Well Log Window. They can be displayed in Map views, 3D, and seismic viewers as well (provided the trajectory is well defined).
This new format allows more complex edition operation, heterogeneous log curves in the same well data, and a new time/depth conversion process.
Synthesis Window
The EWD structure allows more flexibility in log and well edition. The EWD Synthesis window exhibits all logs and well metadata.
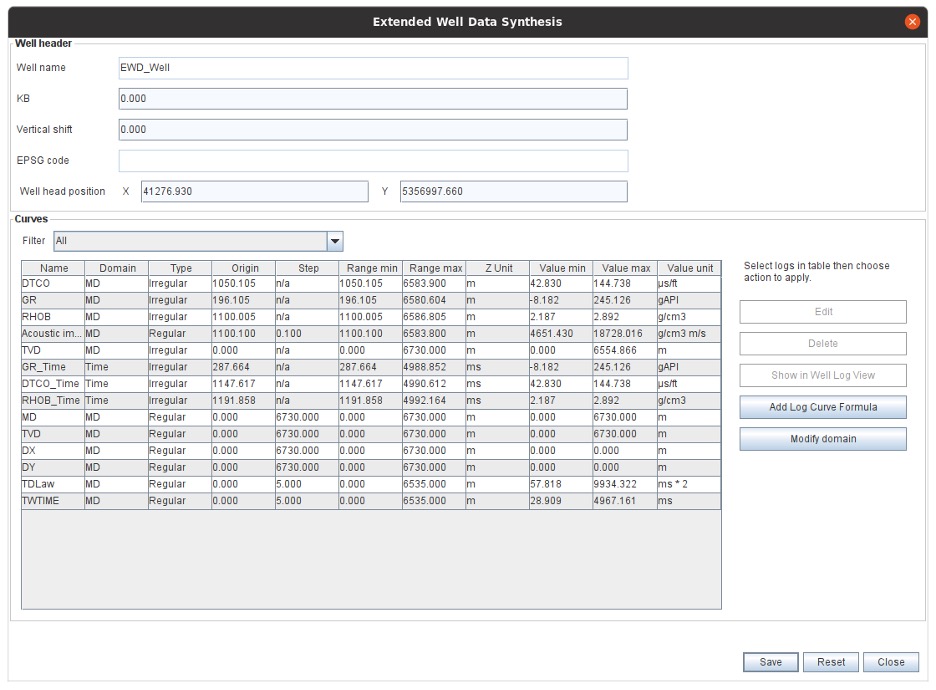
On this window some actions are available:
- Metadata edition
- Add curves with formula
- Remove curves
- Open Well Log Window with selected curves
Curve data can be edited using the Log Curve editor.
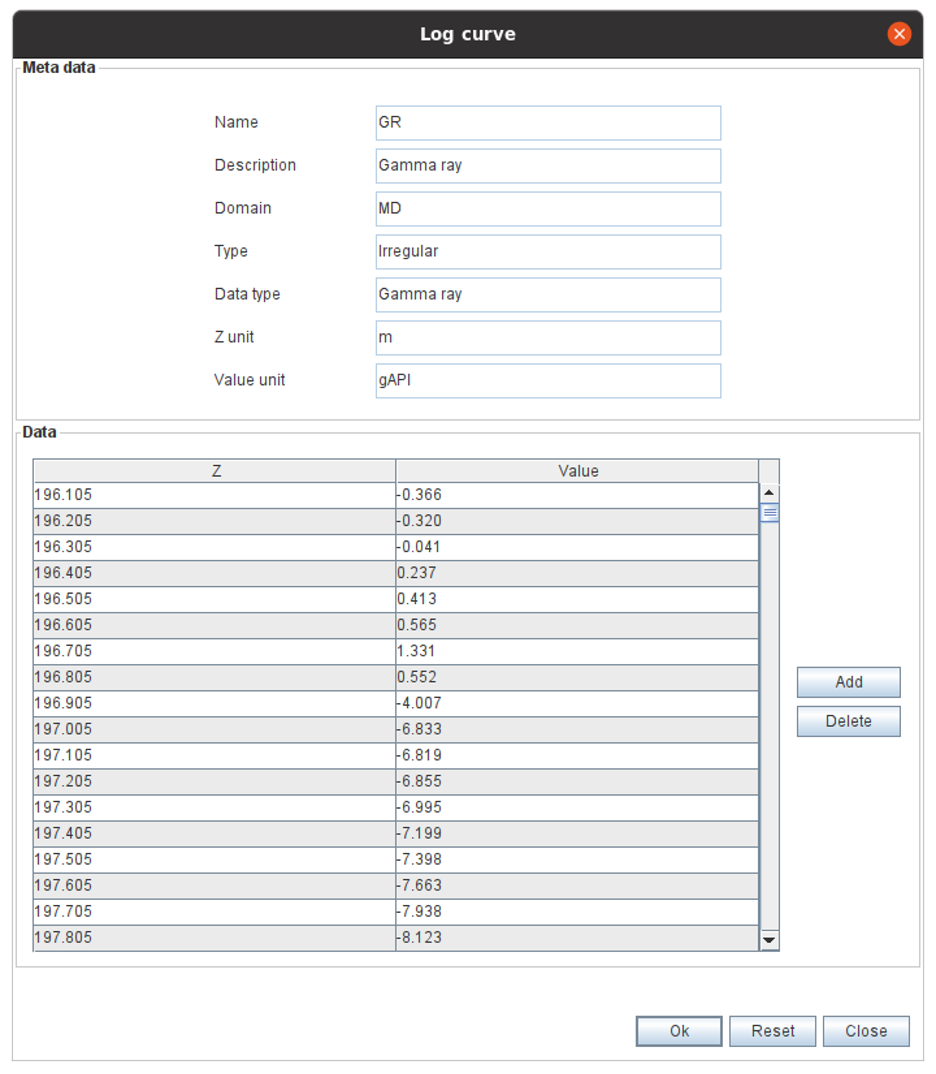
Z and values can be edited, samples can be added or removed, and data can be copied in an external spreadsheet, then pasted back in the editor after modification.
Contrary to standard LAS data, EWD allows log curves to have heterogeneous Z columns, and various samples count. Each log curve can then be edited individually without affecting other curves sampling.
To learn more about how to edit wells in INTViewer, check out our video tutorial:
Log Curve Formula
Like with standard LAS-based well data, curves can be added using a formula. Since log curves can have different Z units, users will be forbidden to mix time and depth curves using formulas.
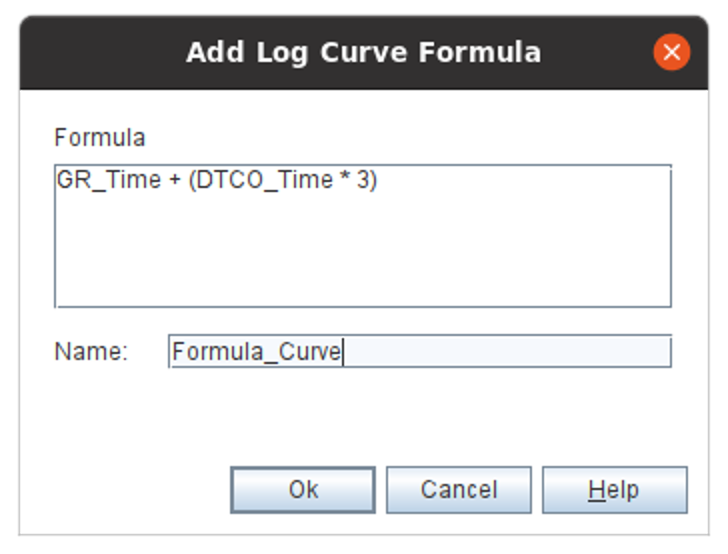
Since curves can be edited individually and have different sampling, the result curve, and all other curves used as input, will be resampled to the sampling of the first data found in the formula (in the image above GR_Time will be used).
Formula editor can be started from the main synthesis window, and also from the popup menu on the EWD node.
Time / Depth Conversion
By defining a curve as Time / Depth law (typically a curve that will have time or depth unit for data values, and opposite unit for Z values), EWD offers the ability to perform Time/Depth conversion. A simple editor to choose the data to convert and the law to use is opened when Time Depth conversion action is launched:
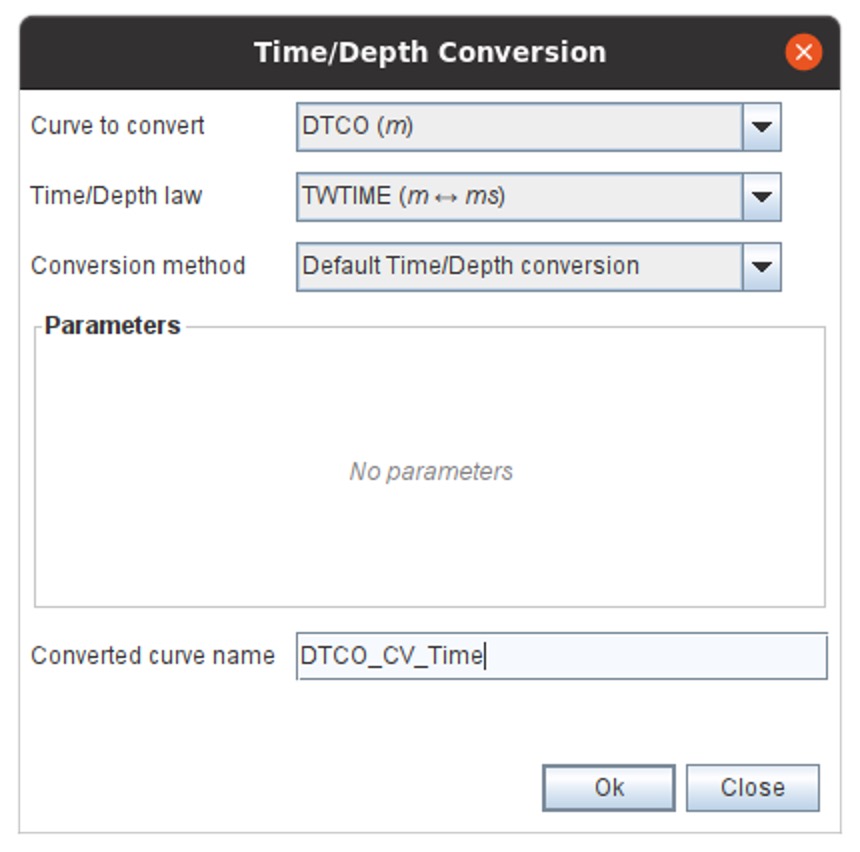
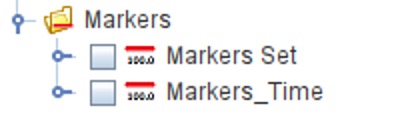
Time / Depth conversion can be performed on logs, but also on Markers. The EWD format can hold several Markers set, each having time or depth unit.
Time/Depth conversion action can be found on the main EWD synthesis window, but it’s also available from the EWD contextual menu in Well Log Window.
The Time/Depth conversion process is a simple sample-by-sample linear interpolation using the Time/Depth law as reference. A more complex process, eventually with parameters, can be added with customization.
LAS Import/Export
EWD can be created from LAS files and exported to LAS files after edition. LAS data can then be imported as EWD in INTViewer 2021. Users can perform various editions, time/depth conversion, and other actions, then export the result in standard LAS to use the data outside INTViewer 2021.
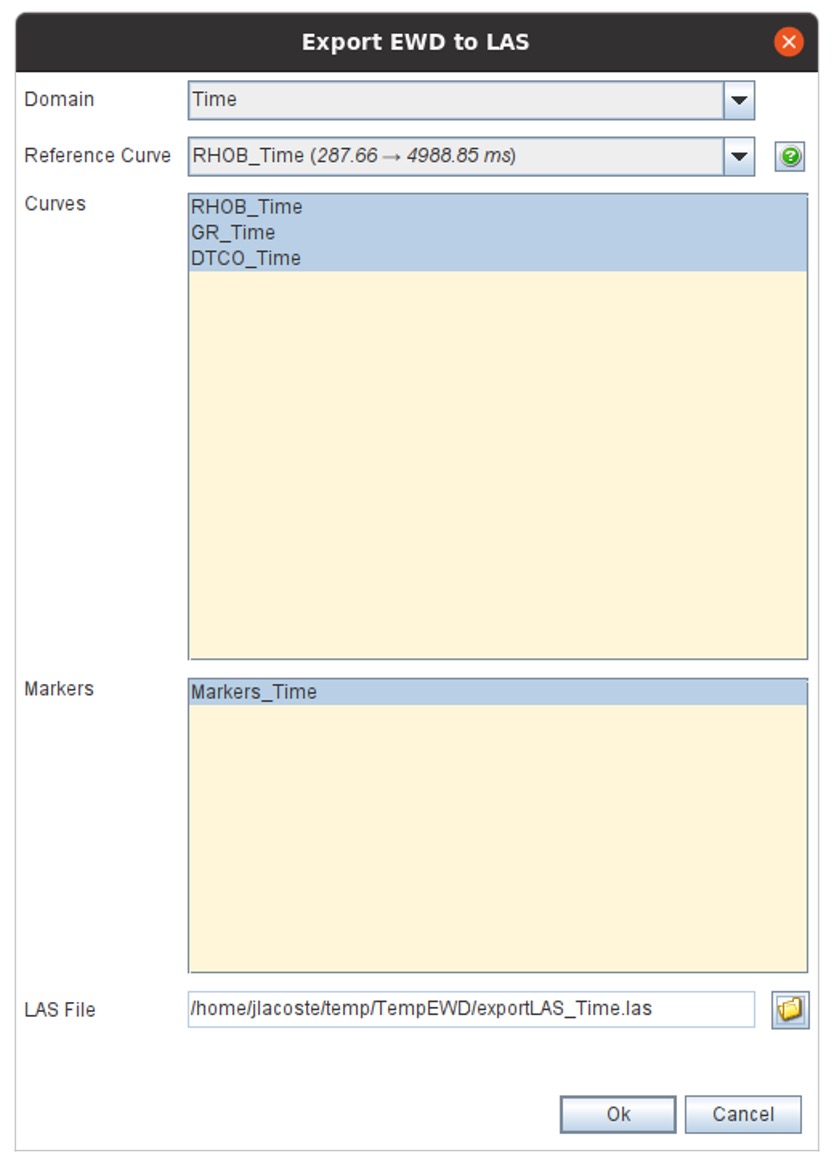
When exporting to LAS, the data domain must be specified (a LAS can only contain data sharing the same Z unit). Users can also choose which data to export. The following screenshot shows an EWD data and the exported LAS side by side.
In the EWD view log curves and markers are in depth, the time depth law is displayed in green. Converted and exported data are in time.
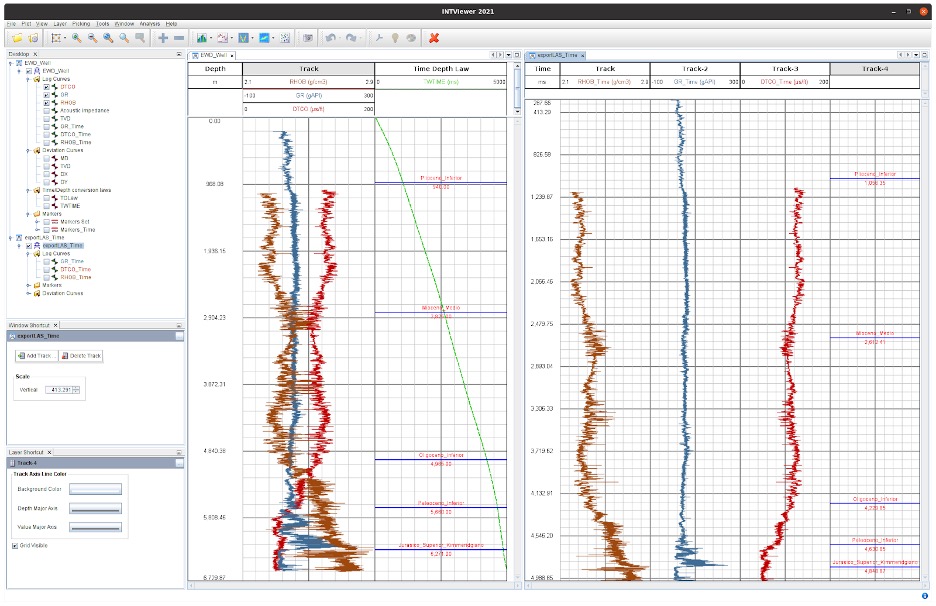
Users have the choice with EWD to display or not in the same view time and depth data.
Customization
The Extended Well Data GUIs can be customized to offer more specific behaviour to the standard EWD functionalities. So a specific plugin will be able to modify:
- EWD Synthesis customization
- Specific header panel
- Custom table filters
- Custom table control (available units, domain, validation)
- Time/Depth conversion
- Conversion process and parameters can be added
For more information on INTViewer, please visit www.int.com/products/intviewer/