This post was co-authored by Kadri Umay, Principal Program Manager, Microsoft.
Energy companies are currently going through a massive transformation by moving hundreds of applications to monitor, interpret, and administer their data into the cloud. In addition, they have embarked on adopting a common data standard, the OSDU™ Data Platform, to simplify interoperability between applications to facilitate data access, exchange, and collaboration.
With Microsoft Energy Data Services, energy companies can leverage new cloud-based advanced data visualization capabilities for geoscientists provided by INT and Microsoft Energy Data Services.
Microsoft Energy Data Services is a data platform fully supported by Microsoft, that enables efficient data management, standardization, liberation, and consumption in energy exploration. The solution is a hyperscale data ecosystem that leverages the capabilities of the OSDU Data Platform and Microsoft’s secure and trustworthy cloud services with our partners’ extensive domain expertise.
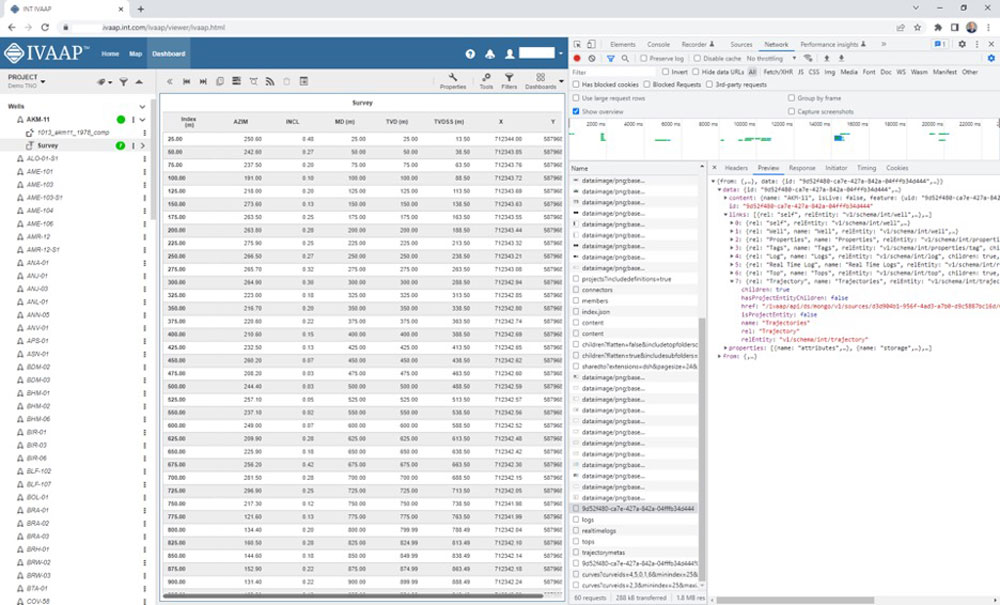
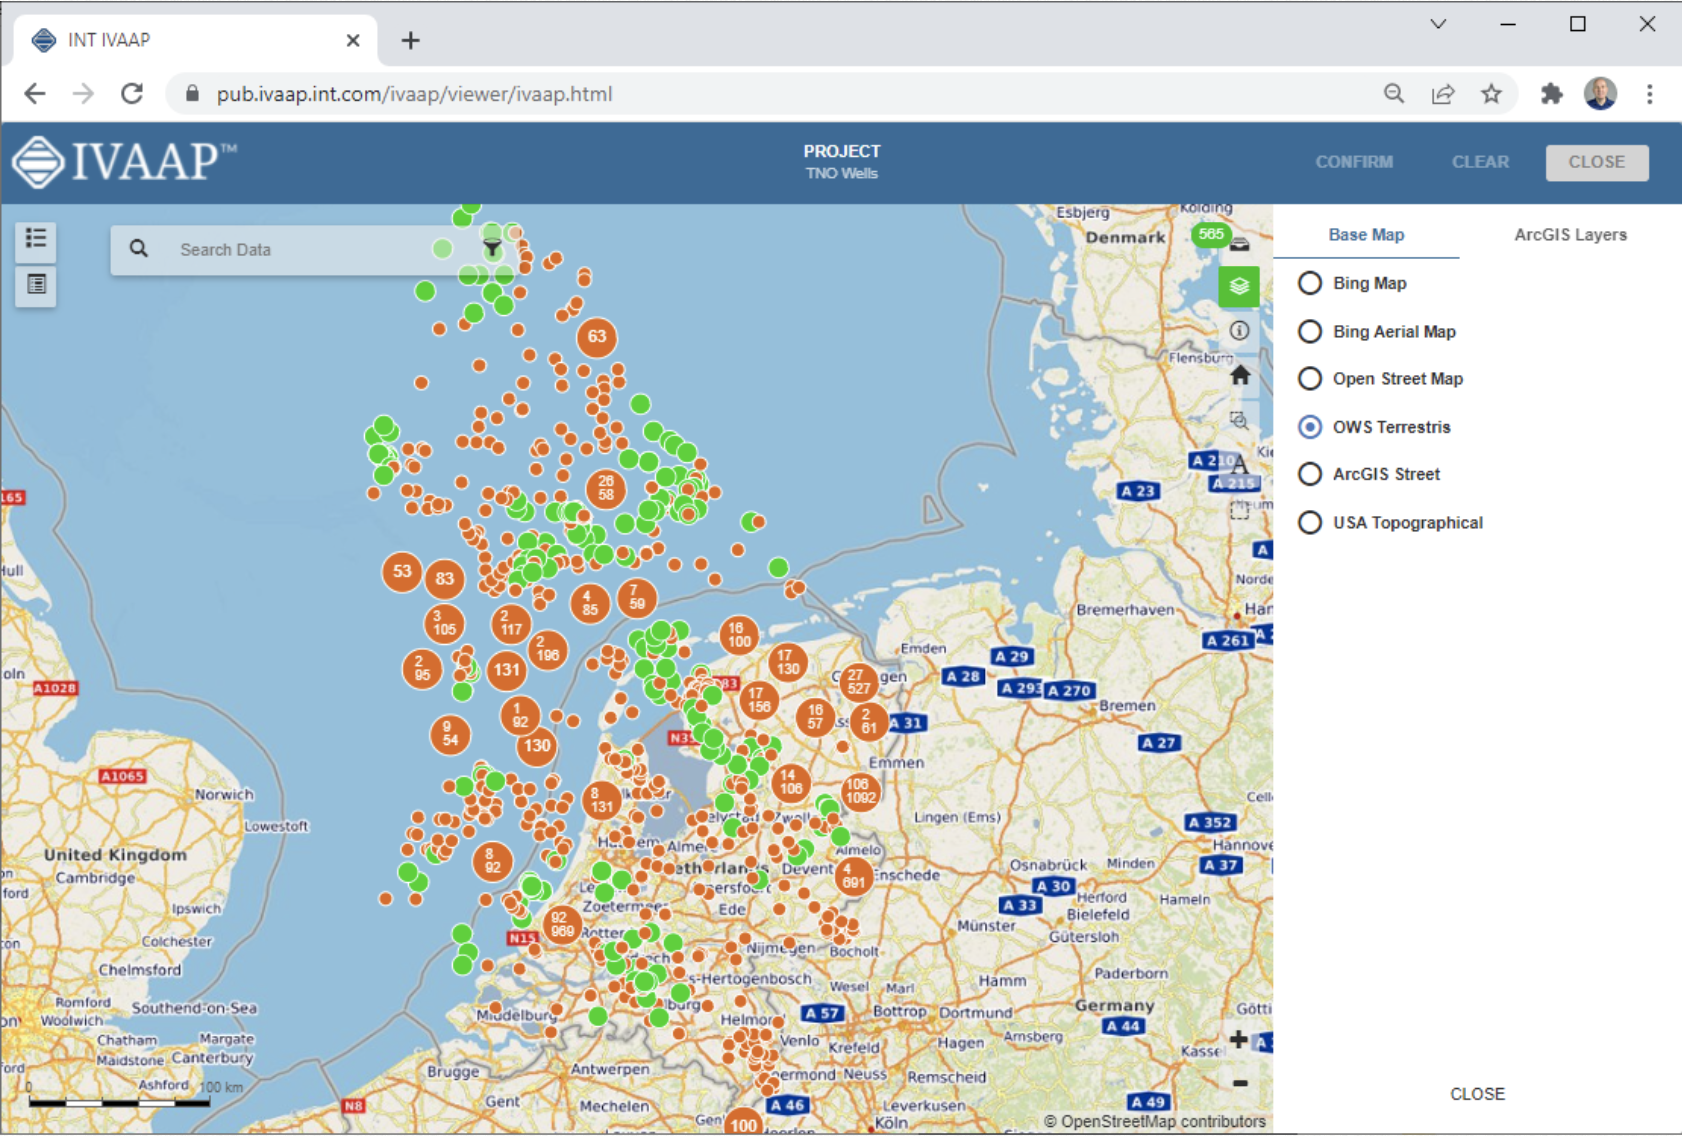
INT is proud to be among the early adopters who have been involved since the preview of Microsoft Energy Data Services. INT is a very active member of the OSDU Forum that offers IVAAP™, an advanced data visualization platform that allows geoscientists to easily access, interact with, and visualize data to create dashboards within Microsoft Azure, leveraging Microsoft Energy Data Services.
The IVAAP data visualization platform helps geoscientists and data scientists simplify their data work with the following features:
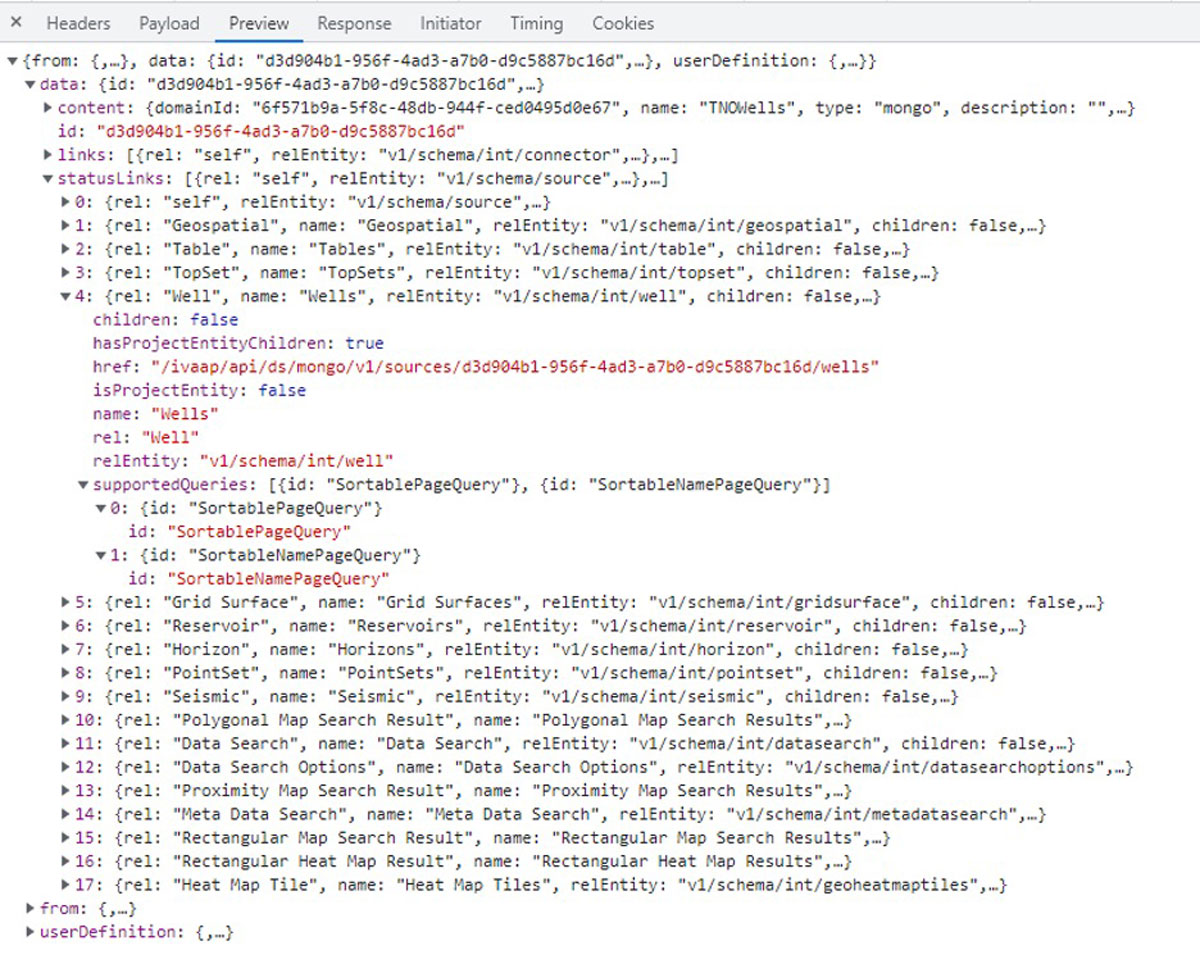
- Access to the OSDU Data Platform is already supported (well, seismic, reservoir), and any other data sources from a single application in the cloud.
- Full interoperability, which means data types aligned with the OSDU Data Platform can be extended to support custom formats and aggregate custom DDMS.
- Intuitive, user-defined dashboards for engineers, geophysicists, and managers to visualize and interact with large datasets of well logs and seismic schematics, build data collections, and launch their machine learning—all from one place.
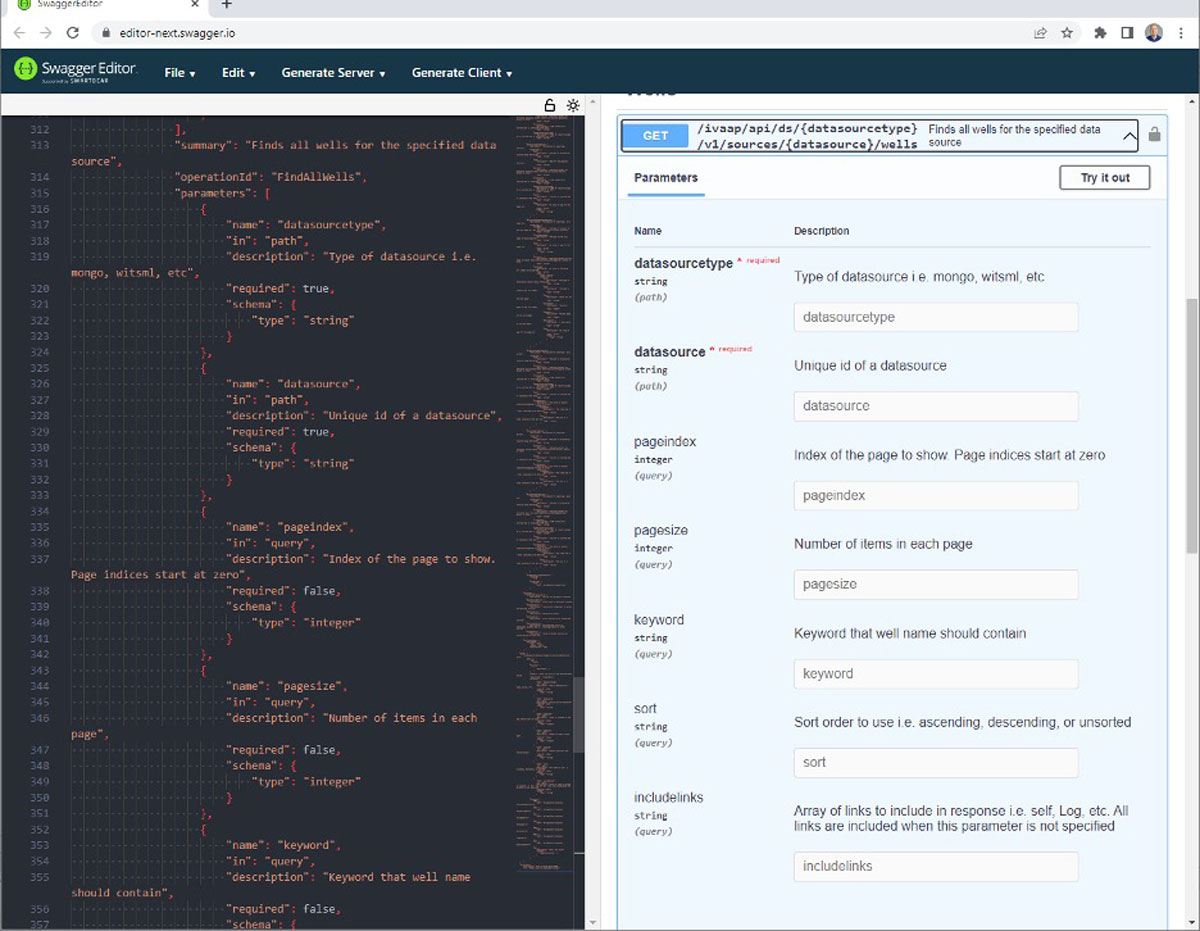
- Many standard data connectors, powerful APIs, and SDKs that provide developers and architects ways to implement their own workflow easily.
- Accelerated delivery of geoscience, drilling, and production cloud-enabled solutions with seamless support on Microsoft Azure.
“Providing a reliable, trusted platform as a service that accelerates the deployment of the OSDU Data Platform is key for any successful cloud transformation. Through the IVAAP platform’s integration with Microsoft Azure, customers will now have immediate access to these capabilities. This integration will simplify the access and provisioning of the massive amount of data generated by the energy industry, enabling impeccable and secure digital interactions. Our partnership with Microsoft in deploying Microsoft Energy Data Services is an important step toward our goal of providing reliable, cost-effective solutions for energy ISVs in the OSDU Data Platform.”
—Dr. Hughes Thevoux-Chabuel, VP Cloud Solutions, INT
Microsoft Energy Data Services is an enterprise-grade, fully managed OSDU Data Platform for the energy industry that is efficient, standardized, easy to deploy, and scalable for data management—ingesting, aggregating, storing, searching, and retrieving data. The offering will provide the scale, security, privacy, and compliance expected by our enterprise customers. The platform offers out-of-the-box compatibility with INT IVAAP, an advanced data visualization platform that allows geoscientists to easily access, interact with, and visualize the OSDU Data Platform to create dashboards with data contained in Microsoft Energy Data Services.
Learn more
- Get started with Microsoft Energy Data Services today.
- Watch the INT demo: IVAAP Data Visualization on Microsoft Azure using Microsoft Energy Data Services.
Visit us online at int.com/ivaap for a preview of IVAAP or for a demo of INT’s other data visualization products.
For more information, please visit www.int.com or contact us at intinfo@int.com.