One of the productivity features of the IVAAP Data Backend SDK is that the services developed with this SDK are container-agnostic. Practically, it means that a REST service developed on your PC using your favorite IDE and deployed locally to Apache Tomcat will run without changes on IVAAP’s Play cluster.
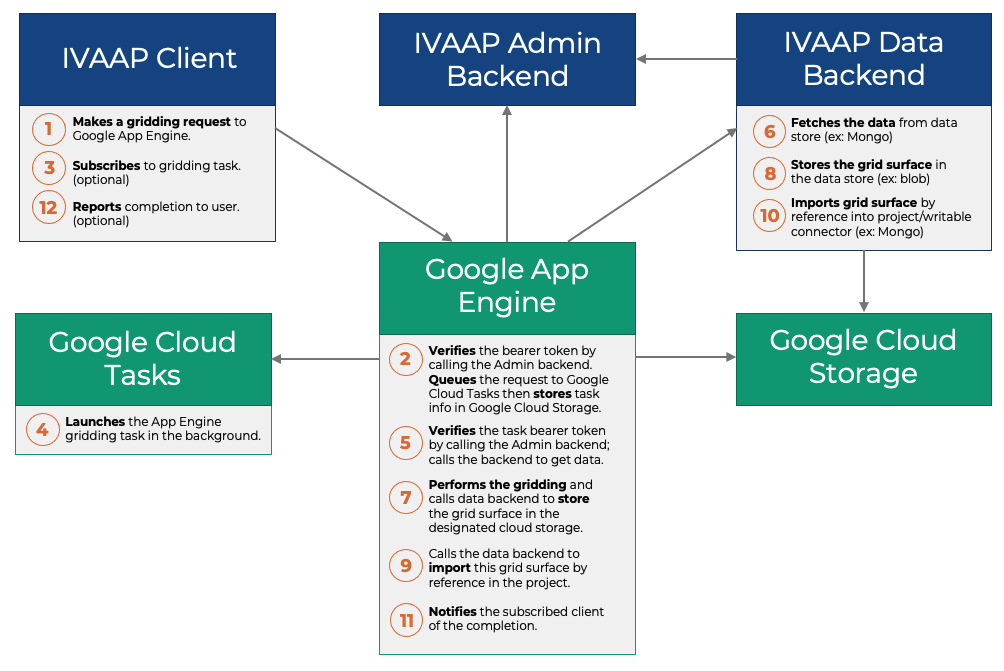
While the Data Backend SDK is traditionally used to serve data, it is also a good candidate when it comes to developing non-data-related services. For example, as part of IVAAP 2.8, we worked on a gridding service. In a nutshell, this service computes a grid surface based upon the positions of a top across the wells of a project. When we tested this service, we didn’t deploy it to IVAAP’s cluster; it was deployed as a standalone application, as a servlet, on a virtual machine (VM).
Deploying Apache Tomcat on a virtual machine is “old school”. Our customers are rapidly moving to the cloud, and while VMs are often a practical choice, other options are sometimes available. One of these options is Google App Engine. Google App Engine is a bit of a pioneer of cloud-based deployments. It was the first product that allowed servlet deployments that scale automatically, without having to worry about the underlying infrastructure of virtual machines. This “infinite” scalability comes with quite a few constraints, and I was curious to find out whether services developed with the IVAAP Data Backend SDK could live within these constraints (spoiler alert: it can).
Synchronous Servlet Support
The first constraint was the lack of support for asynchronous servlets. Google App Engine doesn’t support asynchronous servlets and the IVAAP servlet shipped with the SDK is strictly asynchronous. Supporting the synchronous requirements of Google App Engine didn’t take much time. The main change was to modify the concrete implementation of
com.interactive.ivaap.server.servlets.async.AbstractServiceRequest.waitForResponse
and wait on a java.util.concurrent.CountDownLatch instead of calling javax.servlet.startAsync().
Local File Access
The second constraint was the lack of a local file system. Google App Engine doesn’t let developers access the local files of the virtual machine where an application is deployed. The IVAAP Data Backend SDK typically doesn’t make much use of the local file system, except at startup when it reads its service configuration. To authorize users, the services developed with the IVAAP Data Backend SDK need to know how to validate Bearer tokens, and this validation requires the knowledge of the host name of the IVAAP Admin Backend. The Admin Backend exposes REST services for the validation of Bearer tokens. To support Google App Engine, I had to make the discovery of these configuration files pluggable so that they can be read from the WEB-INF directory of the servlet instead of a directory external to that servlet.
Persistence Mechanism
The third constraint was the lack of persistence. Google App Engine doesn’t provide a way to “remember” information between two HTTP calls. To effectively support computing services, a REST API cannot make an HTTP client “wait” for the completion of this computing. The computation might take minutes, even hours. The REST API of a computing service has to give a “ticket” number back to the client when a process starts, and provide a way for this client to observe the progress of that ticket, all the way to the completion. In a typical servlet deployment, there are many options to achieve this: the service can use the Java Heap to store the ticket information or use a database. To achieve the same result with Google App Engine, I needed to pick a persistence mechanism. For simplicity’s sake, I picked Google Cloud Storage. The state of each ticket is stored as a file in that storage.
Background Task Executions
The fourth constraint was the lack of support for background executions. Google App Engine by itself doesn’t allow processes to execute in the background. Google however provides integration with another product called Google Cloud Tasks. Using the Google Cloud Tasks API, you can submit HTTP requests to a queue, and Google Cloud Tasks will make sure these requests get executed eventually. Essentially, when the gridding service receives an HTTP request, it creates a ticket number, submits this HTTP request immediately to Google Cloud Tasks, which in turn calls back Google App Engine. The IVAAP service recognizes that the call comes from Google Cloud Tasks and stores the result to a file in Google Cloud Storage instead of the servlet output stream. It then notifies the client that the process has completed.
Here’s a diagram that describes the complete workflow:
Constraints and Considerations
While the SDK did provide the API to implement this workflow out of the box, getting this to work took a bit of time. I had to learn 3 Google products at once to get it working. Also, I encountered obstacles that I will share here so that other developers benefit:
- The first obstacle was that the Java SDK for Google App Engine requires the Eclipse IDE. There is no support for the NetBeans IDE. I am more proficient with NetBeans.
- The second obstacle was that I had to register my Eclipse IDE with Google so I can deploy code from that environment. It just happened that that day, the Google registration server was having issues, blocking me from making progress.
- The third obstacle was the use of Java 8. The Google Cloud SDK required Java 8, but Eclipse defaulted to Java 11. It took me a while to understand the arcane error messages thrown at me.
- The fourth obstacle was that I had to pick a flavor of Google App Engine, either “Standard” or “Flexible”. The “Standard” option is cheaper to run because it doesn’t require an instance running at all times. The “Flexible” option has less warmup time because there is always at least one instance running. There are many more differences, not all of them well documented. The two options are similar, but do not share the same API. You don’t write the same code for both environments. In the end, I picked the “Standard” option because it was the most constraining, better suited to a proof of concept.
- The fifth obstacle was the confusion due to the word “Promote” used by the Google SDK when deploying an instance. In this context, “Promote” doesn’t mean “advertising”, it means “production”. For a while, I couldn’t figure out why my application wouldn’t show any changes where I expected them. The answer was that I didn’t “promote” them.
- The last obstacle was the logging system. Google has a “Google Logging” product to access logs produced by your application. Logging is essential to debugging unruly code that you can’t run locally. Despite several weeks of use, I still haven’t figured out how this product really works. It is designed to be used to monitor an application in production, not so much for debugging. Debugging with logs is difficult. There might be several reasons why you can’t find a log. The first possibility is that the code doesn’t go where you think it’s going, and the log is not produced. The second possibility is that the log was produced, but I am too impatient, there is a significant delay and it hasn’t shown up yet. The third possibility is that it has shown up, but is nested inside some obscure hierarchy, and you won’t see it unless you expand the entire tree of logs. The log search doesn’t help much and has some strange UI quirks. I found that the most practical way to explore logs is to download them locally, then use the search capabilities of a text editor. Because the running servlet is not local to your development environment, debugging a Google App Engine application is a time-consuming activity.
In the end, the IVAAP Data Backend SDK passed this proof of concept with flying colors. Despite the constraints and obstacles of the environment, all the REST services that were written with the IVAAP Cluster in mind are compatible with Google App Engine, without any changes. Programming is hard, it’s an investment in time and resources. Developing with the IVAAP Data Backend SDK preserves your investment because it makes a minimum amount of assumptions on how and where you will run this code.
For more information or for a free demo of IVAAP, visit int.com/products/ivaap/.