In the world of geospatial data, precise coordinate transformations are essential. Apache SIS is a powerful open-source library that can be used to perform a wide variety of coordinate operations. As described in our previous blog, How Apache SIS Simplifies the Hidden Complexity of Coordinate Systems in IVAAP, Apache SIS can pick the best conversion steps to use when converting points from one Coordinate Reference System (CRS) to another Coordinate Reference System, which can be useful in several different scenarios where a user does not know which conversion steps they want to use when converting from one CRS to another.
In this technical guide, we’ll dive into how to leverage Apache SIS to perform advanced CRS conversion with explicit control over each step. We’ll cover the four primary conversion steps, explore when to use each, and provide code samples to walk you through the process. Whether you’re dealing with projected or geographic coordinate systems, complex transformations, or the need for intermediate CRS like WGS 84, this guide will help you master these CRS conversions with Apache SIS.
We will be referencing the CRS we are converting from as the From CRS and the CRS we are converting to as the To CRS.
Conversion Step 1: From CRS Projection
Conversion Step 2: From CRS Transformation to WGS 84
Conversion Step 3: Transformation from WGS 84
Conversion Step 4: To CRS Projection
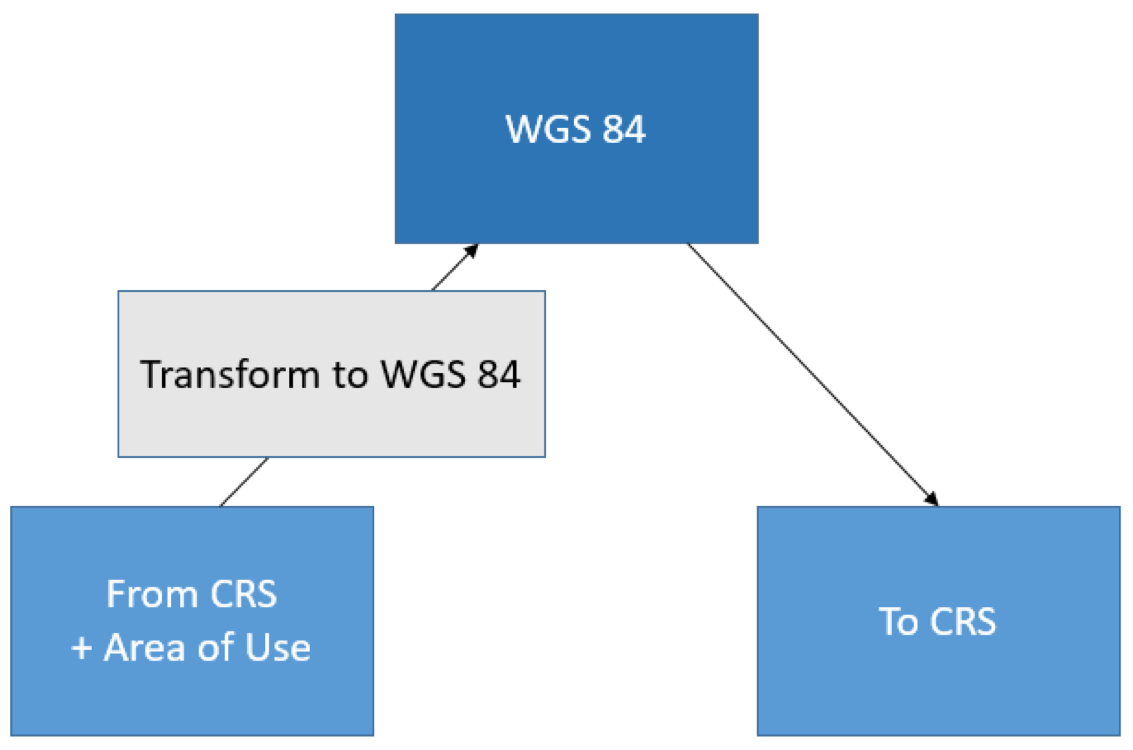
We will assume that the transformations defined are To WGS 84 Transformations. These steps will be using the WGS 84 CRS as an intermediate CRS for the transformation operations.
Each of the four conversion steps is optional. In most scenarios, most steps will not be used.
To showcase how Apache SIS can be used to specify each of these steps, we will be picking a scenario where all four conversion steps are required. We will be converting from CRS AGD66 / AMG zone 56 to CRS AGD84 / AMG zone 56 using From CRS Transformation AGD66 to WGS 84 (17) and To CRS Transformation AGD84 to WGS 84 (1) (https://epsg.io/1109).
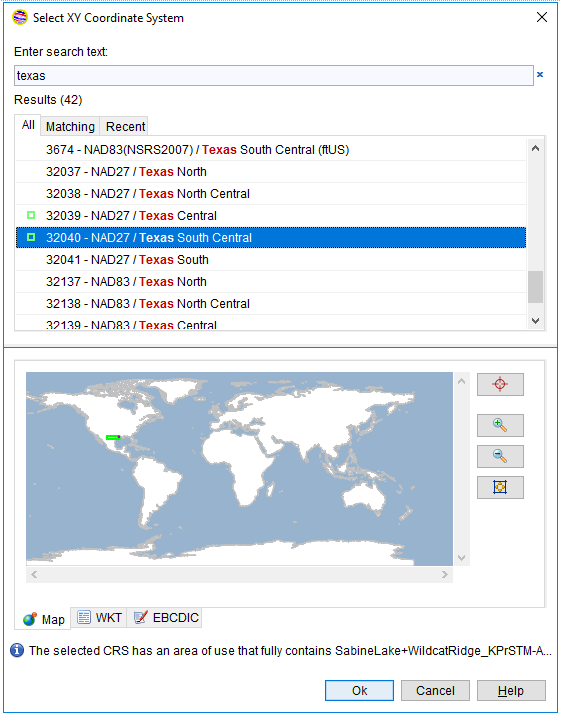
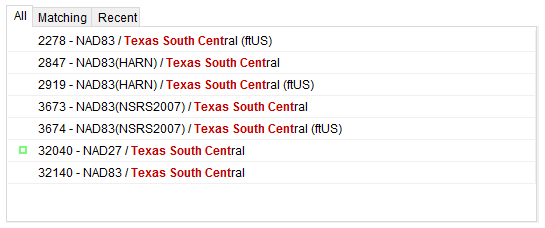
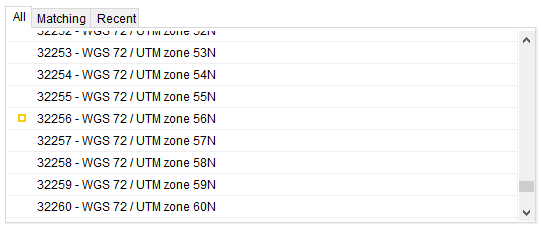
To start, we establish the CRSs and transformations required for our conversion. We use the CRSAuthorityFactory class to create the CRSs and the CoordinateOperationAuthorityFactory class for transformations and other related operations. In this example, we’ll use EPSG codes to define our CRSs and transformations, although Well-Known Text (WKT) representations can also be used if needed.
CRSAuthorityFactory authorityFactory = CRS.getAuthorityFactory("EPSG");
CoordinateOperationAuthorityFactory opFactory = (CoordinateOperationAuthorityFactory) CRS.getAuthorityFactory("EPSG");

ProjectedCRS fromCRS = authorityFactory.createProjectedCRS("EPSG:20256");
fromCRS = (ProjectedCRS) AbstractCRS.castOrCopy(fromCRS).forConvention(AxesConvention.DISPLAY_ORIENTED);
CoordinateOperation fromTr = opFactory.createCoordinateOperation("EPSG:15786");

ProjectedCRS toCRS = authorityFactory.createProjectedCRS("EPSG:20356");
toCRS = (ProjectedCRS) AbstractCRS.castOrCopy(toCRS).forConvention(AxesConvention.DISPLAY_ORIENTED);
CoordinateOperation toTr = opFactory.createCoordinateOperation("EPSG:1109");
In this example, we know that the CRSs are projections so we can use the CoordinateOperationAuthorityFactory.createProjectedCRS method to create a ProjectedCRS object. If the specific type of CRS is unknown, you can use the CoordinateOperationAuthorityFactory.createCoordinateReferenceSystem method to create a generic CRS object.
After the ProjectedCRS objects have been created, we will need to get the base CRS associated with the ProjectedCRS. This can be done using the ProjectedCRS.getBaseCRS.
GeographicCRS toBaseCRS = toCRS.getBaseCRS();
toBaseCRS = (GeographicCRS) AbstractCRS.castOrCopy(toBaseCRS).forConvention(AxesConvention.DISPLAY_ORIENTED);
GeographicCRS fromBaseCRS = fromCRS.getBaseCRS();
fromBaseCRS = (GeographicCRS) AbstractCRS.castOrCopy(fromBaseCRS).forConvention(AxesConvention.DISPLAY_ORIENTED);
From CRS Projection
The first conversion step that may be needed is a CRS projection. This is needed for the use case where the From CRS is a projected CRS.
CoordinateOperation fromProj = CRS.findOperation(fromCRS, fromBaseCRS, null);
MathTransform fromProjTransform = fromProj.getMathTransform();
CoordinateSystemAxis fromProjFirstAxis = fromProj.getSourceCRS().getCoordinateSystem().getAxis(0);
if (fromProjFirstAxis.getDirection() == AxisDirection.NORTH) {
    Matrix swapMatrix = Matrices.createTransform(
            new AxisDirection[]{AxisDirection.NORTH, AxisDirection.EAST},
            new AxisDirection[]{AxisDirection.EAST, AxisDirection.NORTH});
    fromProjTransform = MathTransforms.concatenate(MathTransforms.linear(swapMatrix), fromProjTransform);
}
fromProjTransform.transform(xyInputCoordinates, 0, xyOutputCoordinates, 0, 1);
The above code section will perform the conversion step needed to convert points from the From CRS to its base CRS. This code includes a check on the order of the axis for the projection. This is needed because some CRS projections or transformations will flip the order of points from x, y to y, x. We want to ensure that the output of this conversion will be in the format of x, y or longitude, latitude.
From CRS Transformation to WGS 84
The second conversion step that may be needed is to perform a transformation to WSG 84.
CoordinateOperation xyToDatumOperation = CRS.findOperation(fromBaseCRS, fromTr.getSourceCRS(), null);
MathTransform fromTrStep1 = xyToDatumOperation.getMathTransform();
MathTransform fromTrStep2 = fromTr.getMathTransform();
MathTransform fromTrTransform = MathTransforms.concatenate(fromTrStep1, fromTrStep2);
CoordinateSystemAxis fromTrFirstAxis = fromTr.getSourceCRS().getCoordinateSystem().getAxis(0);
if (fromTrFirstAxis.getDirection() == AxisDirection.NORTH) {
    Matrix swapMatrix = Matrices.createTransform(
            new AxisDirection[]{AxisDirection.NORTH, AxisDirection.EAST},
            new AxisDirection[]{AxisDirection.EAST, AxisDirection.NORTH});
    fromTrTransform = MathTransforms.concatenate(fromTrTransform, MathTransforms.linear(swapMatrix));
}
fromTrTransform.transform(xyInputCoordinates, 0, xyOutputCoordinates, 0, 1);
The above code will perform the conversion step needed to convert points from the base CRS of the From CRS to WGS 84 using the From CRS Transformation. Similar to the Projection Step mentioned earlier, we may need to flip the axis. An additional conversion is needed to convert from the base CRS to the source CRS of the From CRS Transformation.
To CRS Transformation to WGS 84
The third conversion step that may be needed is to perform a transformation from WSG 84 to the base CRS of the To CRS.
CoordinateOperation datumToXYOperation = CRS.findOperation(toTr.getSourceCRS(), toBaseCRS, null);
MathTransform toTrStep1 = toTr.getMathTransform().inverse();
MathTransform toTrStep2 = datumToXYOperation.getMathTransform();
MathTransform toTrTransform = MathTransforms.concatenate(toTrStep1, toTrStep2);
CoordinateSystemAxis toTrFirstAxis = toTr.getSourceCRS().getCoordinateSystem().getAxis(0);
if (toTrFirstAxis.getDirection() == AxisDirection.NORTH) {
    Matrix swapMatrix = Matrices.createTransform(
            new AxisDirection[]{AxisDirection.NORTH, AxisDirection.EAST},
            new AxisDirection[]{AxisDirection.EAST, AxisDirection.NORTH});
    toTrTransform = MathTransforms.concatenate(MathTransforms.linear(swapMatrix), toTrTransform);
}
toTrTransform.transform(xyInputCoordinates, 0, xyOutputCoordinates, 0, 1);
The above code will perform the conversion step needed to convert points from the WGS 84 to the base CRS of the To CRS to WGS 84 using the To CRS Transformation. This is similar to the Transformation to WGS 84 except we have to reverse the order of conversions and invert the transformation.
To CRS Projection
The fourth and last conversion step that may be needed is a CRS projection. This is needed for the use case where the To CRS is a projected CRS.
CoordinateOperation toProj = CRS.findOperation(toBaseCRS, toCRS, null);
MathTransform toProjTransform = toProj.getMathTransform();
CoordinateSystemAxis toProjFirstAxis = toProj.getSourceCRS().getCoordinateSystem().getAxis(0);
if (toProjFirstAxis.getDirection() == AxisDirection.NORTH) {
    Matrix swapMatrix = Matrices.createTransform(
            new AxisDirection[]{AxisDirection.NORTH, AxisDirection.EAST},
            new AxisDirection[]{AxisDirection.EAST, AxisDirection.NORTH});
    toProjTransform = MathTransforms.concatenate(MathTransforms.linear(swapMatrix), toProjTransform);
}
toProjTransform.transform(xyInputCoordinates, 0, xyOutputCoordinates, 0, 1);
The above code section will perform the conversion step needed to convert points from the To CRS base CRS to the To CRS. This code will be similar to the code section for From CRS Projection.
The full code section that contains all the conversion steps listed above is shown below
CRSAuthorityFactory authorityFactory = CRS.getAuthorityFactory("EPSG");
CoordinateOperationAuthorityFactory opFactory = (CoordinateOperationAuthorityFactory) CRS.getAuthorityFactory("EPSG");

ProjectedCRS fromCRS = authorityFactory.createProjectedCRS("EPSG:20256");
fromCRS = (ProjectedCRS) AbstractCRS.castOrCopy(fromCRS).forConvention(AxesConvention.DISPLAY_ORIENTED);
CoordinateOperation fromTr = opFactory.createCoordinateOperation("EPSG:15786");

ProjectedCRS toCRS = authorityFactory.createProjectedCRS("EPSG:20356");
toCRS = (ProjectedCRS) AbstractCRS.castOrCopy(toCRS).forConvention(AxesConvention.DISPLAY_ORIENTED);
CoordinateOperation toTr = opFactory.createCoordinateOperation("EPSG:1109");

GeographicCRS fromBaseCRS = fromCRS.getBaseCRS();
fromBaseCRS = (GeographicCRS) AbstractCRS.castOrCopy(fromBaseCRS).forConvention(AxesConvention.DISPLAY_ORIENTED);
GeographicCRS toBaseCRS = toCRS.getBaseCRS();
toBaseCRS = (GeographicCRS) AbstractCRS.castOrCopy(toBaseCRS).forConvention(AxesConvention.DISPLAY_ORIENTED);

CoordinateOperation fromProj = CRS.findOperation(fromCRS, fromBaseCRS, null);
MathTransform fromProjTransform = fromProj.getMathTransform();
CoordinateSystemAxis fromProjFirstAxis = fromProj.getSourceCRS().getCoordinateSystem().getAxis(0);
if (fromProjFirstAxis.getDirection() == AxisDirection.NORTH) {
    Matrix swapMatrix = Matrices.createTransform(
            new AxisDirection[]{AxisDirection.NORTH, AxisDirection.EAST},
            new AxisDirection[]{AxisDirection.EAST, AxisDirection.NORTH});
    fromProjTransform = MathTransforms.concatenate(MathTransforms.linear(swapMatrix), fromProjTransform);
}
fromProjTransform.transform(xyInputCoordinates, 0, xyOutputCoordinates, 0, 1);

System.arraycopy(xyOutputCoordinates, 0, xyInputCoordinates,0,  xyOutputCoordinates.length);

CoordinateOperation xyToDatumOperation = CRS.findOperation(fromBaseCRS, fromTr.getSourceCRS(), null);
MathTransform fromTrStep1 = xyToDatumOperation.getMathTransform();
MathTransform fromTrStep2 = fromTr.getMathTransform();
MathTransform fromTrTransform = MathTransforms.concatenate(fromTrStep1, fromTrStep2);
CoordinateSystemAxis fromTrFirstAxis = fromTr.getSourceCRS().getCoordinateSystem().getAxis(0);
if (fromTrFirstAxis.getDirection() == AxisDirection.NORTH) {
    Matrix swapMatrix = Matrices.createTransform(
            new AxisDirection[]{AxisDirection.NORTH, AxisDirection.EAST},
            new AxisDirection[]{AxisDirection.EAST, AxisDirection.NORTH});
    fromTrTransform = MathTransforms.concatenate(fromTrTransform, MathTransforms.linear(swapMatrix));
}
fromTrTransform.transform(xyInputCoordinates, 0, xyOutputCoordinates, 0, 1);

System.arraycopy(xyOutputCoordinates, 0, xyInputCoordinates,0,  xyOutputCoordinates.length);

CoordinateOperation datumToXYOperation = CRS.findOperation(toTr.getSourceCRS(), toBaseCRS, null);
MathTransform toTrStep1 = toTr.getMathTransform().inverse();
MathTransform toTrStep2 = datumToXYOperation.getMathTransform();
MathTransform toTrTransform = MathTransforms.concatenate(toTrStep1, toTrStep2);
CoordinateSystemAxis toTrFirstAxis = toTr.getSourceCRS().getCoordinateSystem().getAxis(0);
if (toTrFirstAxis.getDirection() == AxisDirection.NORTH) {
    Matrix swapMatrix = Matrices.createTransform(
            new AxisDirection[]{AxisDirection.NORTH, AxisDirection.EAST},
            new AxisDirection[]{AxisDirection.EAST, AxisDirection.NORTH});
    toTrTransform = MathTransforms.concatenate(MathTransforms.linear(swapMatrix), toTrTransform);
}
toTrTransform.transform(xyInputCoordinates, 0, xyOutputCoordinates, 0, 1);

System.arraycopy(xyOutputCoordinates, 0, xyInputCoordinates,0,  xyOutputCoordinates.length);

CoordinateOperation toProj = CRS.findOperation(toBaseCRS, toCRS, null);
MathTransform toProjTransform = toProj.getMathTransform();
CoordinateSystemAxis toProjFirstAxis = toProj.getSourceCRS().getCoordinateSystem().getAxis(0);
if (toProjFirstAxis.getDirection() == AxisDirection.NORTH) {
    Matrix swapMatrix = Matrices.createTransform(
            new AxisDirection[]{AxisDirection.NORTH, AxisDirection.EAST},
            new AxisDirection[]{AxisDirection.EAST, AxisDirection.NORTH});
    toProjTransform = MathTransforms.concatenate(MathTransforms.linear(swapMatrix), toProjTransform);
}
toProjTransform.transform(xyInputCoordinates, 0, xyOutputCoordinates, 0, 1);
Using all of these steps will allow users to perform most CRS conversions. This example also allows the user to know what the coordinate points values are after each conversion step. Most CRS conversions will not require all four conversion steps.
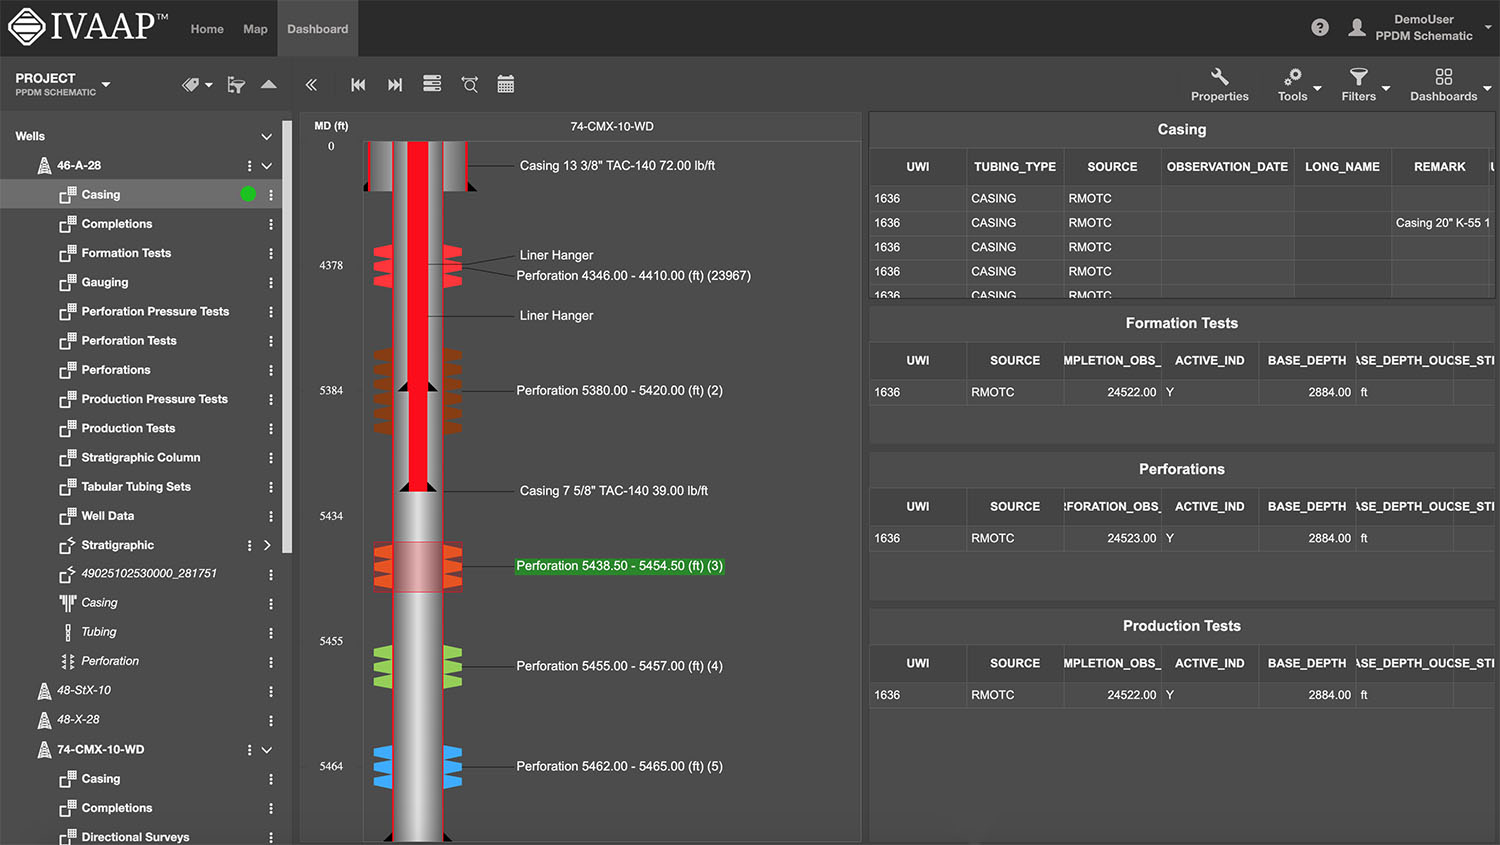
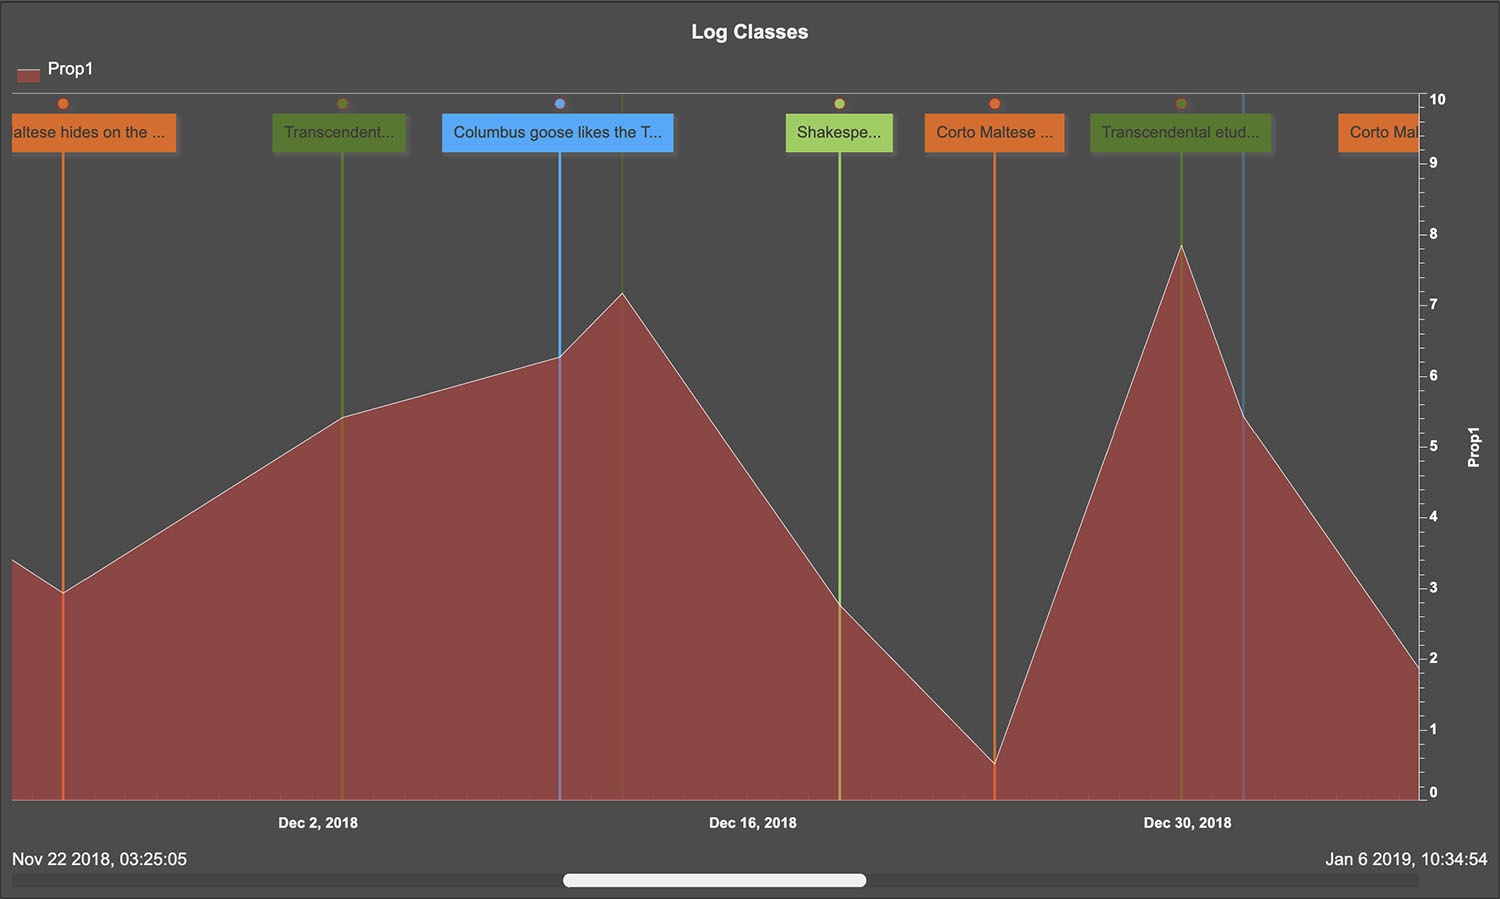
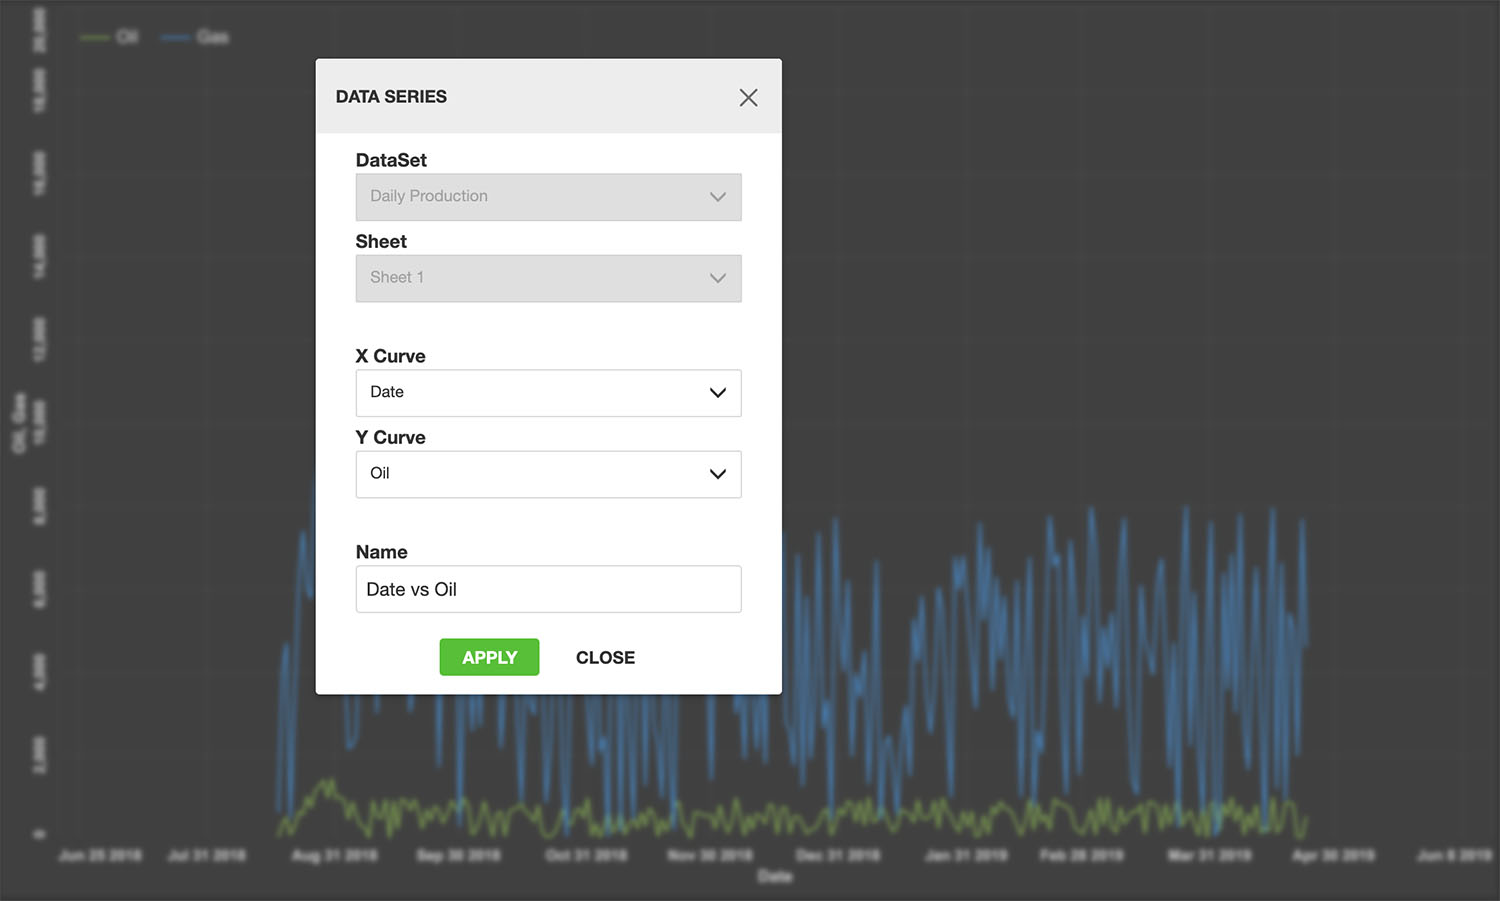
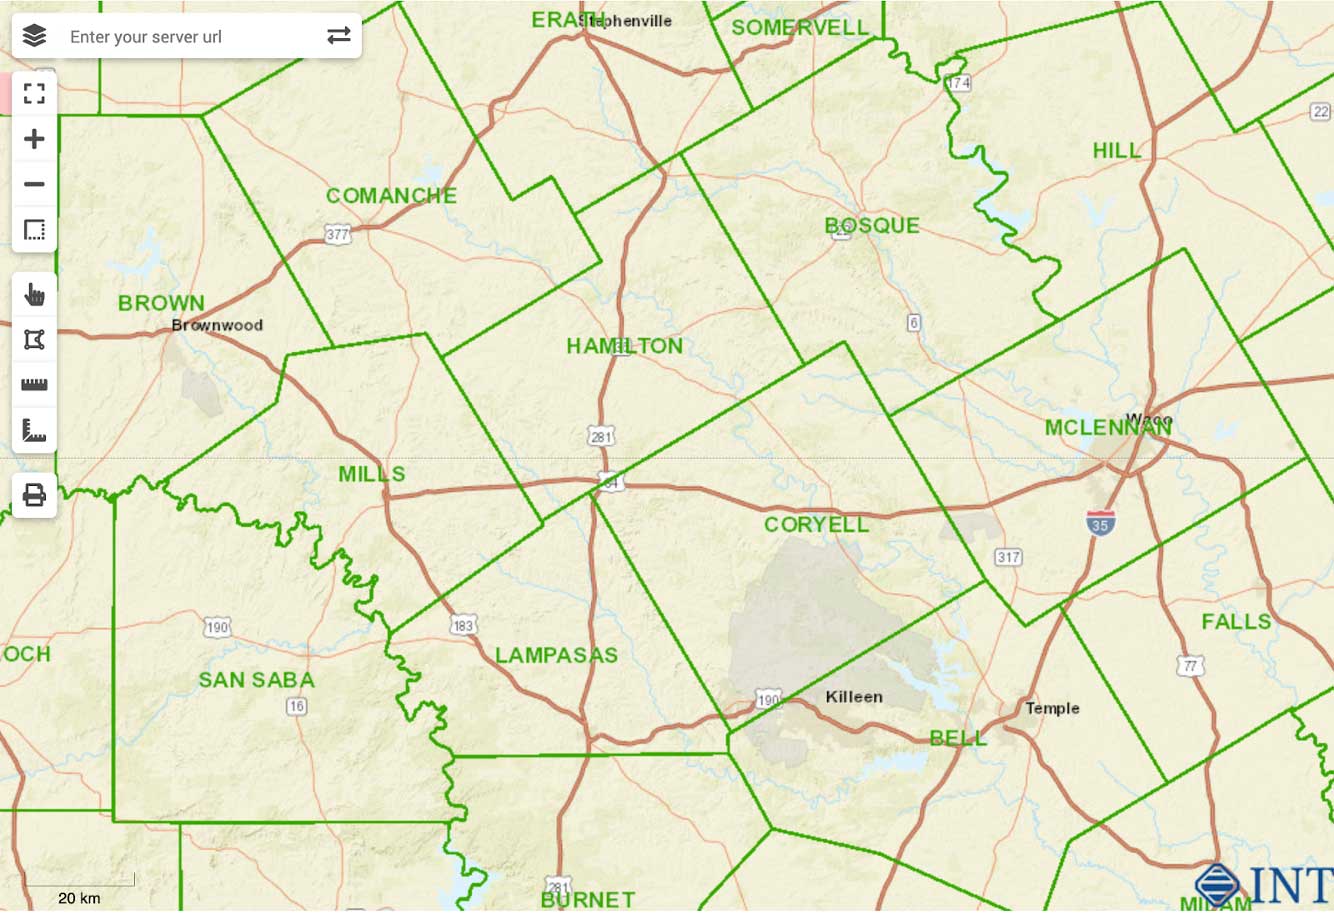
Visit us online at int.com/ivaap for a preview of IVAAP or for a demo of INT’s other data visualization products.
For more information, please visit www.int.com or contact us at intinfo@int.com.