• Skip to main content
  • Skip to footer

INT

Empowering Visualization

CONTACT US SUPPORT
MENUMENU
  • Products
    • Overview
    • IVAAP™
    • INTViewer™
    • GeoToolkit™
    • Product Overview
  • Demos
    • GeoToolkit Demos
    • IVAAP Demos
  • Success Stories
  • Solutions
    • Overview
    • For E&P
    • For OSDU Visualization
    • For Cloud Partners
    • For Machine Learning
    • For CCUS
    • For Geothermal Energy
    • For Wind Energy
    • For Enterprise
    • Tools for Developers
    • Services Overview
  • Resources
    • Blog
    • Developer Community
    • FAQ
    • INT Resources Library
  • About
    • Overview
    • News
    • Events
    • Careers
    • Meet Our Team
    • About INT

time series

Dec 08 2021

Latest Release of INT’s GeoToolkit.JS Brings More Advanced Features to Develop the Next Generation of Energy Applications

The GeoToolkit.JS 2021.1 release innovation includes new Live Code Sandbox, new features in Schematics and Seismic libraries, and optimized display of 3D Reservoir in a web browser.

Houston, TX — INT’s latest release of GeoToolkit.JS data visualization libraries and toolkit integrates many new features, including new live code sandbox, 3D reservoir optimization, schematics customization capabilities, faster TIFF and raster log rendering, time series customization, and more.

With the new live code playground, developers can work with GeoToolkit code in real time, instantly testing their customizations and iterating quickly to fine-tune functionality.

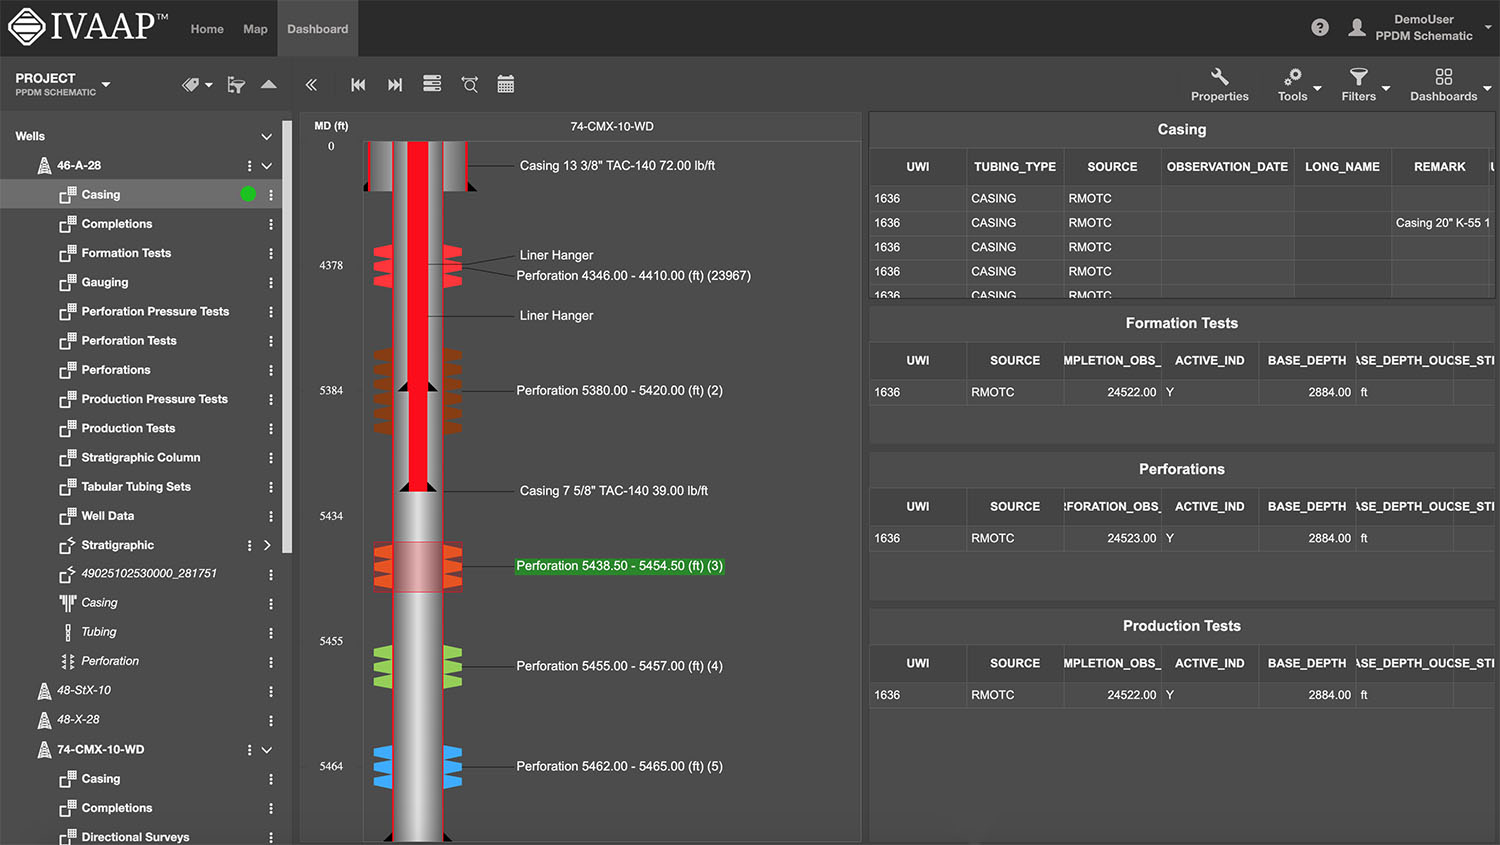
Developers can use the new dual schematics widget which shows/compares two states of schematics in GeoToolkit.JS to implement more complex visualizations, such as planned versus actual drilling. And features like the added horizon intersection for seismic time slice add a layer of context to seismic visualization.

INT is constantly looking at improving performance, adding new functionality, and helping developers enhance the UX experience. But INT is not limiting its technology to the client side. For large datasets, like seismic, reservoir, or big images, the visualization and the web services are tightly coupled so that only a minimum amount of data is sent based on the viewport and the LOD (Level Of Detail).


“We work closely with our users to understand and incorporate their needs within our products. With this GeoToolkit release, we delivered more features and improvements that will further expand our users’ capabilities so they have what they need to customize, build, and deliver their advanced web-based, exploration, drilling and production applications,” said Dr. Olivier Lhemann, President of INT.


GeoToolkit.JS 2021.1 also includes capabilities such as improved TypeScript headers, generation and API reverence, revisited reports generation, and more.

RELEASE HIGHLIGHTS:

  • Live code sandbox — Run tutorials in live code sandbox to test functionality
  • Raster Logs and Cloud TIFF Rendering — Server downloads image from cloud, unpacks TIFF image, copy and scale requested tile, convert image to byte array, send bytes array
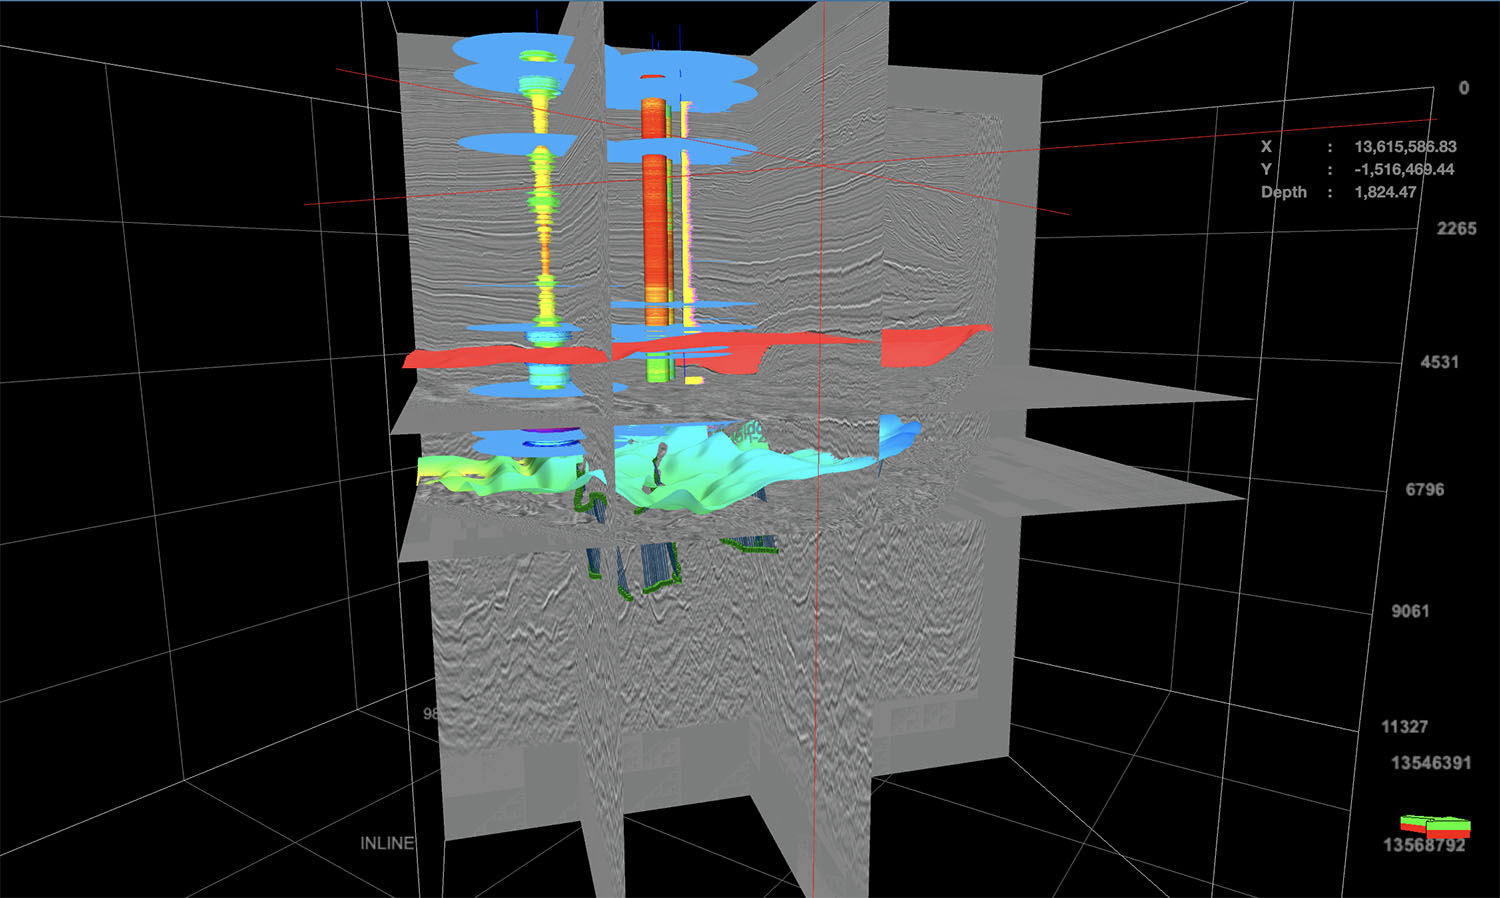
  • 3D Reservoir Optimization and Intersection with Seismic — Optimized reservoir grid with anti-aliasing and improved reservoir performances by filtering cells by IJK/value and neighbor occlusion, intersection of reservoir grid with seismic, and improved seismic intersection points performance and fix interpolation color
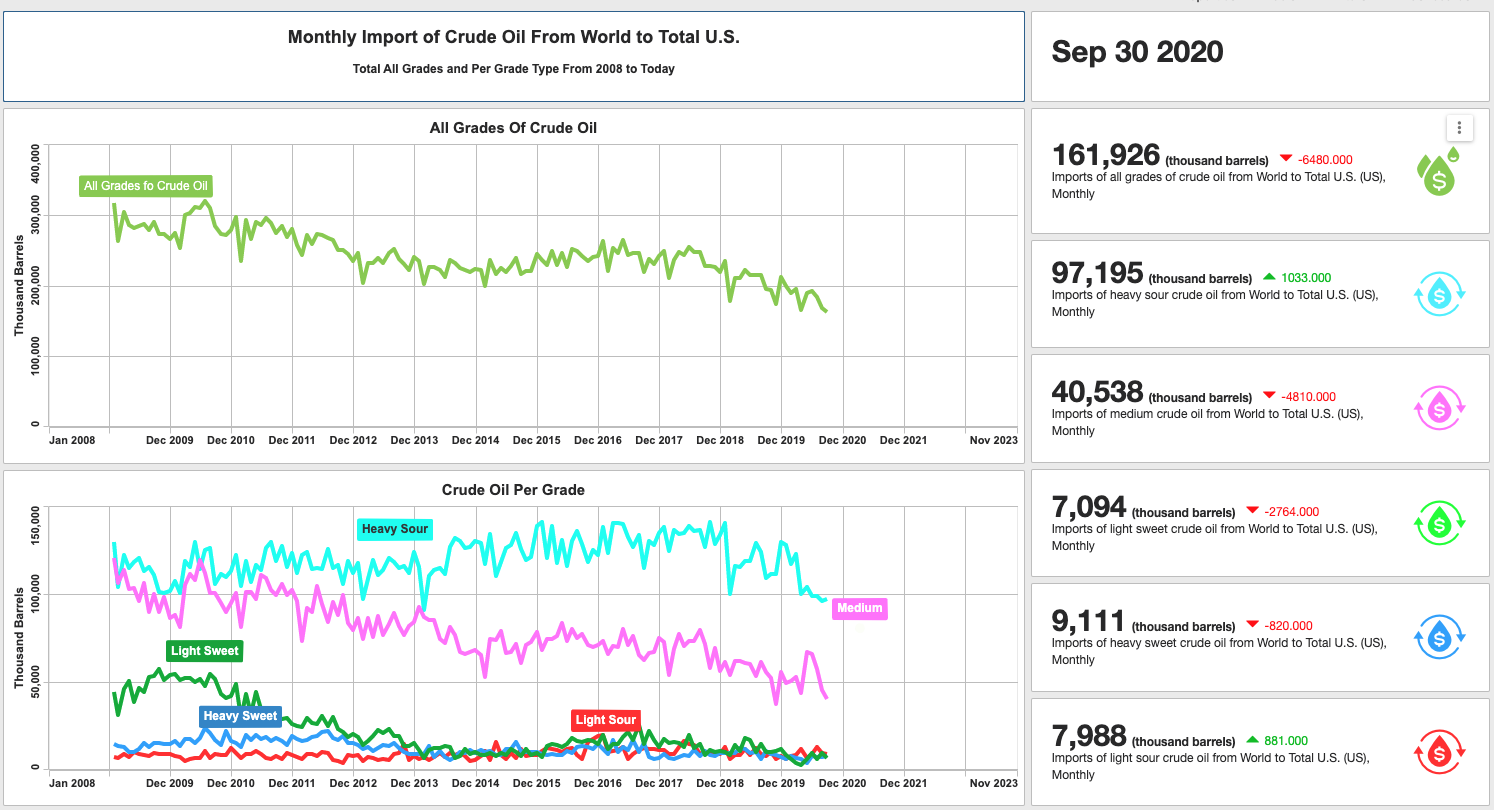
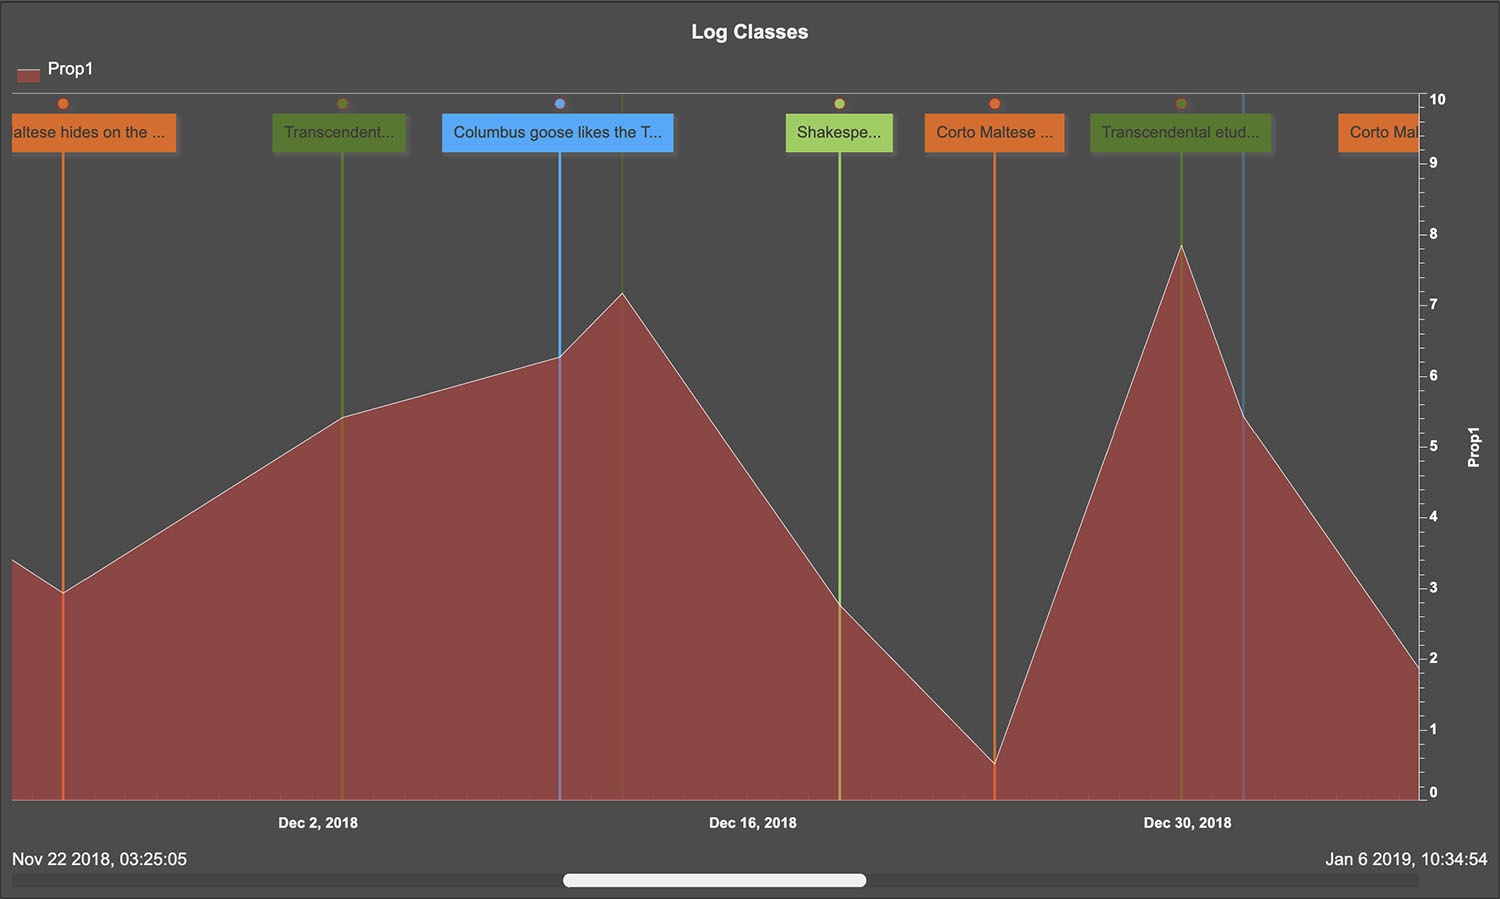
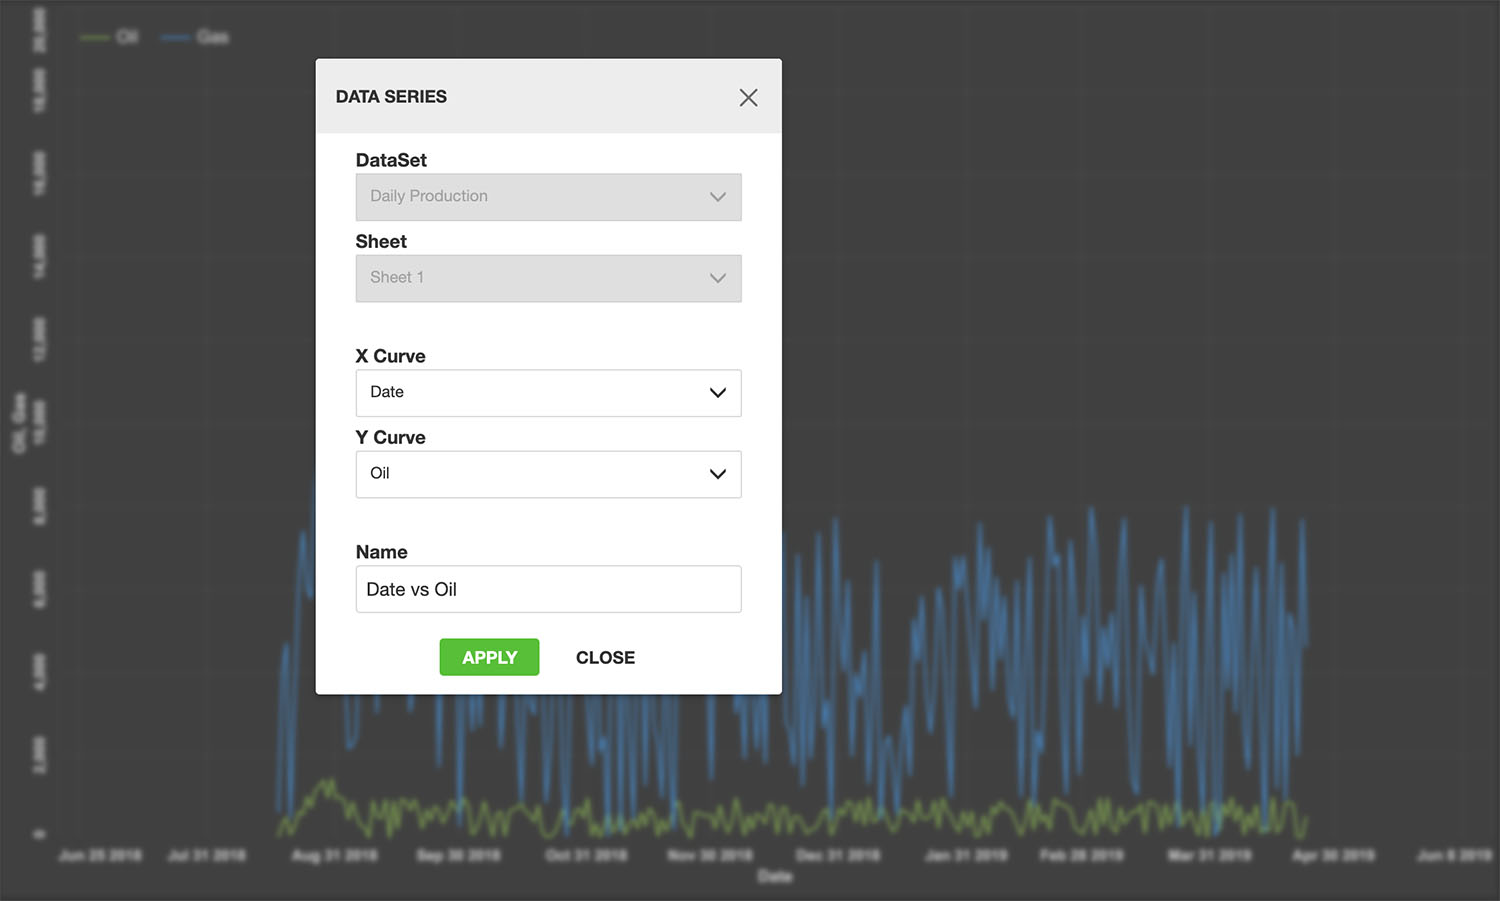
  • Time Series Styles and Customization — Added barchart mode to TimeSeriesWidget and improved auto limits calculation for TimeSeriesWidget
  • Creating PDF Reports with Multiple Widgets — New set of tutorials, CSS support to Document and DocumentViewWidget, virtual DOM
Widgets integration, added text alignment in cell, added page header/footer support, CSS Pseudo-classes, CSS borders, CSS margins

For more information about GeoToolkit.JS or INT’s other data visualization products, please visit www.int.com or contact us at intinfo@int.com.

Read the press release on PRWeb.

To learn more about GeoToolkit.JS 2021, please visit int.com/products/geotoolkit/ or contact us at support@int.com.

____________

ABOUT INT:

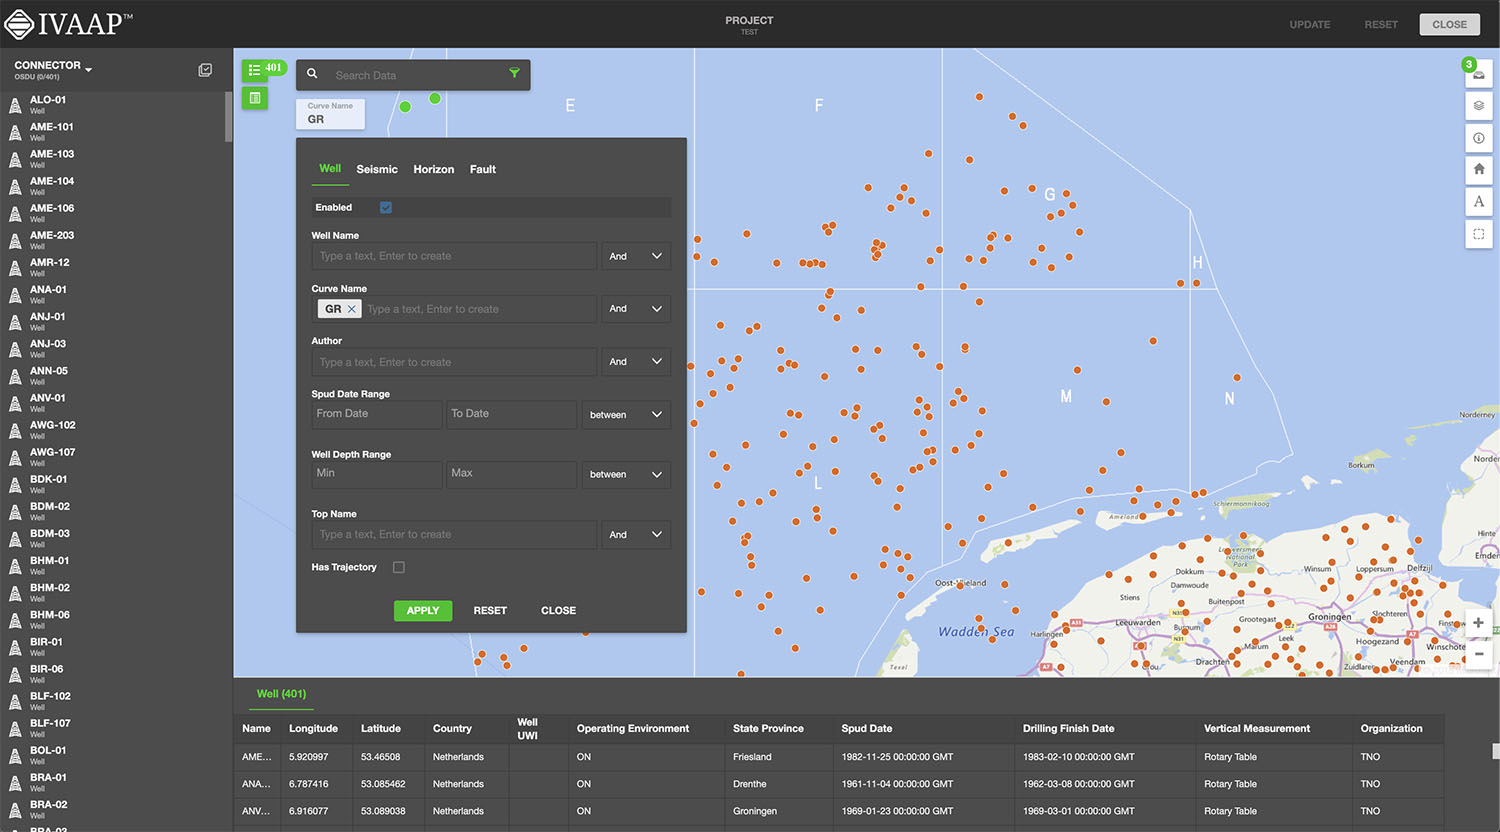
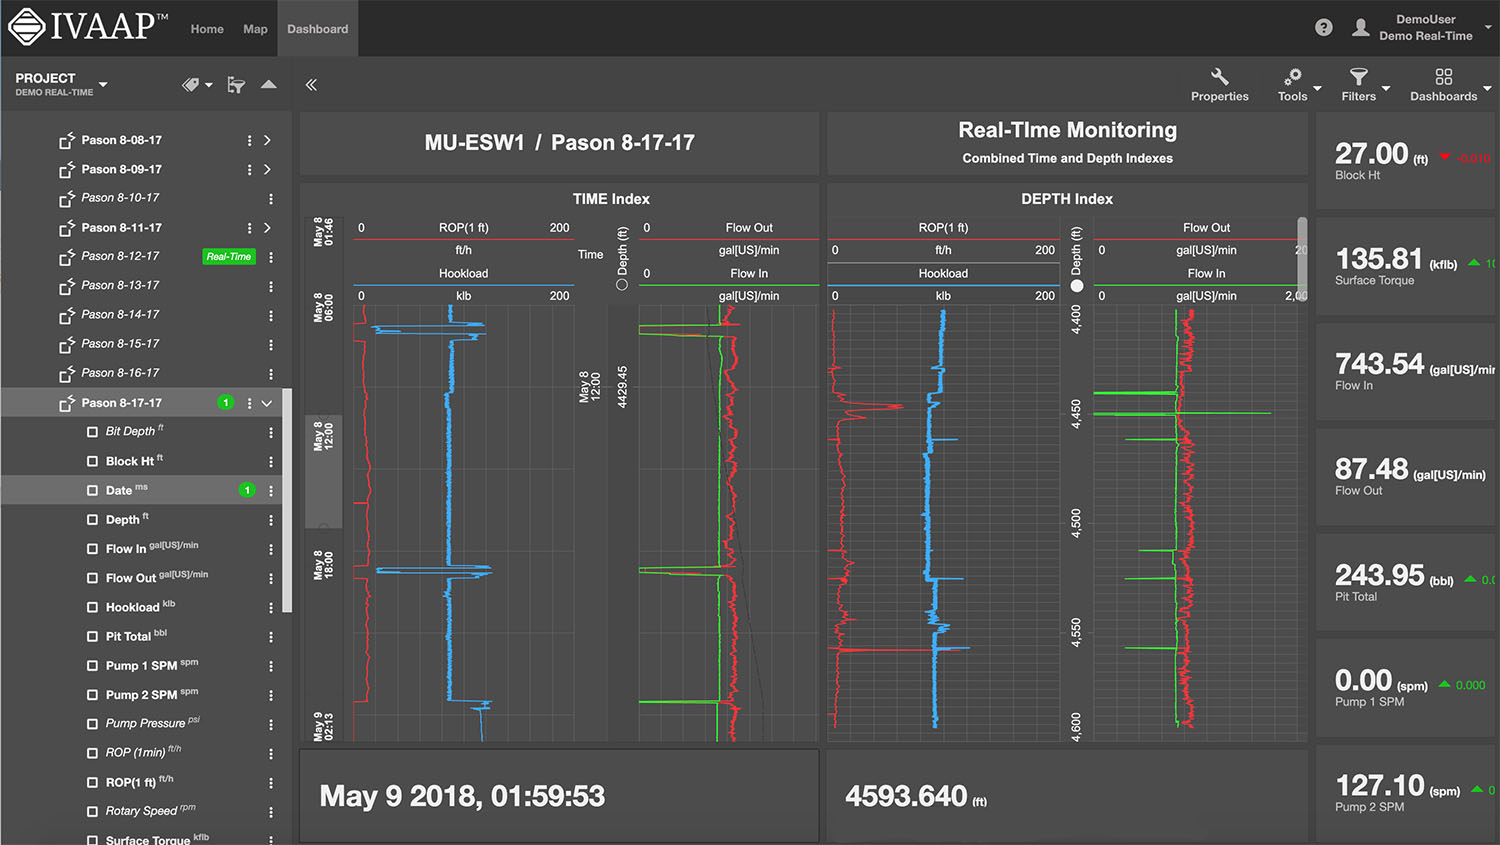
INT software empowers the largest energy and services companies in the world to visualize their complex subsurface data (seismic, well log, reservoir, and schematics in 2D/3D). INT offers a visualization platform (IVAAP) and libraries (GeoToolkit) developers can use with their data ecosystem to deliver subsurface solutions (Exploration, Drilling, Production). INT’s powerful HTML5/JavaScript technology can be used for data aggregation, API services, and high-performance visualization of G&G and petrophysical data in a browser. INT simplifies complex subsurface data visualization.

For more information about GeoToolkit or INT’s other data visualization products, please visit https://www.int.com.

INT, the INT logo, and GeoToolkit are trademarks of Interactive Network Technologies, Inc., in the United States and/or other countries.

Filed Under: GeoToolkit, GeoToolkit (Geoscience), JavaScript, Press Release Tagged With: cloud, energy, oil and gas, subsurface data visualization, time series

Dec 02 2020

IVAAP Release 2.7: More Map Search and ArcGIS Features

IVAAP™ is a subsurface data visualization platform that provides developers and product owners powerful subsurface visualization features for their digital solutions in the cloud. IVAAP enables users to search, access, display, and analyze 2D/3D G&G and petrophysical data in a single user-friendly dashboard on the web. The latest release of IVAAP 2.7 comes with various new features and significant improvements.

Highlights from this release include many advanced search and map capabilities, improved 3D widget filter dialog, new interval curves support, new date/time picker for Cross-Plot widget axis settings, and more! 

Advanced Mapping Capabilities

IVAAP features support for visual-based data discovery using map-based search, and is fully integrated with ArcGIS (ESRI), allowing for the search of structured and unstructured data in a data lake or any other file repository. IVAAP supports a wide range of map formats and services like ArcGIS, GeoJSON, KML, Mapbox, Bing, WMS, and more.

With the ArcGIS integration, you can easily access all layers and details from your ArcGIS server and display them within IVAAP to enrich map-based search of well, seismic, and other subsurface data.

New features include the ability to display a dynamic metadata table for a selected object in the map (Well, Seismic, etc.). 

Most layers are supported. Image services (ArcGIS Image Service Layer, Image Services Vector Layers, and WMS) and Tile services (Image Service, ArcGIS Tiled Map Service Layer, Web Tiled Layer, OpenStreetMap) are supported. Feature Services include map service (ArcGIS Feature Layer), KML, WFS, and CSV. We also provide some real-time services support like stream services (ArcGIS Stream Layer), GeoRSS, Vector Tiles (VectorTileLayer), and Bing Maps services. Two extra formats that are supported are GeoJSON and GPX.

This release includes improved search capabilities allowing search across any metadata for any user. Access to data can be restricted to read-only mode. We also made improvements to fence highlighting and access to well lists, and labels can now be saved with the dashboard.


2_7_0_Map Reduced


More Themes Control 

Previously, theme control within IVAAP was a bit limited. We’ve expanded the theme mechanism to all widgets so that users can customize themes with more control and options and access new updated themes.


2_7_0_Customized Themes

Lightmode theme


New Image Widget 

IVAAP can now display simple image files such as jpeg or png files in the image widget, align, and zoom in to show detail. This feature allows users to customize dashboards with logos or other image files needed to display. 

Improvements in 3D

IVAAP’s 3D widget now supports tagging and aliases when displaying well data. We added reservoir data that can be serialized in the dashboard template. Users now have the ability to mix data with CRS and data without CRS. Another new feature is that users can apply properties to multiple or individual objects. And we’ve improved the dashboard restoration of multiple inlines, crossbones, and time slices. Finally, the 3D widget filter dialog has been redesigned.


2_7_0_3D Reduced


New Features in WellLog

For WellLog, we improved the set main index support for templates, dashboards, and well switching. With this improvement, a secondary index can be used to display data into a different index and secondary indexes can be restored when opening an existing dashboard or template. An improved automatic logarithmic mode gives users the ability to add a curve to a logarithmic track. New features added to WellLog include: the ability to automatically rotate labels for lithology and a reset action where users can right-click with the option to clear their display.


WellLog


New in Schematics

For the Schematics package, new features include: perforation with state definition support, the ability to customize by using a filter dialog, and the ability to use cursor tracking between Schematics and WellLog. We also improved the component selection support in the Schematics widget.


schematics 2.7


Time Series: Annotations and Perforations 

We improved the ability to select a data series from the legend. The Time Series widget now features support for annotations and perforations. The tooltip now shows the index data and time.


TimeSeries


New and Improved Line Chart

The IVAAP line chart now supports templates and data series dialog. We improved the ability to edit existing data series. Users can now flip the axis for date and time data, and the legend has been improved to show or hide the data series parent. There is also an improvement for single data sets, multi-data sets, and multi parent projects. 


LineChart


This release includes many more improvements to features and to the UI. For more information, check out the full release here.

Or check out int.com/ivaap for a preview of IVAAP or for more information about INT’s other data visualization products, please visit www.int.com or contact us at intinfo@int.com.


Filed Under: IVAAP, Uncategorized Tagged With: 3D, annotations, arcgis, CRS, ivaap, line chart, mapping, schematics, time series, welllog

Footer

Solutions

  • For E&P
  • For OSDU Visualization
  • For Cloud Partners
  • For Machine Learning
  • For CCUS
  • For Geothermal Energy
  • For Wind Energy
  • For Enterprise
  • Tools for Developers
  • Customer Success Stories

Products

  • IVAAP
  • GeoToolkit
  • INTViewer
  • IVAAP Demos
  • GeoToolkit Demos

About

  • News
  • Events
  • Careers
  • Management Team

Resources

  • Blog
  • FAQ

Support

  • JIRA
  • Developer Community

Contact

INT logo
© 1989–2023 Interactive Network Technologies, Inc.
Privacy Policy
  • Careers
  • Contact Us
  • Search

COPYRIGHT © 2023 INTERACTIVE NETWORK TECHNOLOGIES, Inc