This release incorporates more features to support development of cloud-based applications for clients in O&G, energy, and other industries.
Houston, TX — May 04, 2021 — INT is pleased to announce GeoToolkit.JS™ 2021, the latest release of INT’s industry-leading data visualization toolkit and libraries for developers. This release brings exciting new features for 3D visualization, enhanced 2D/3D well schematics, and key updates to empower development of data visualization applications.
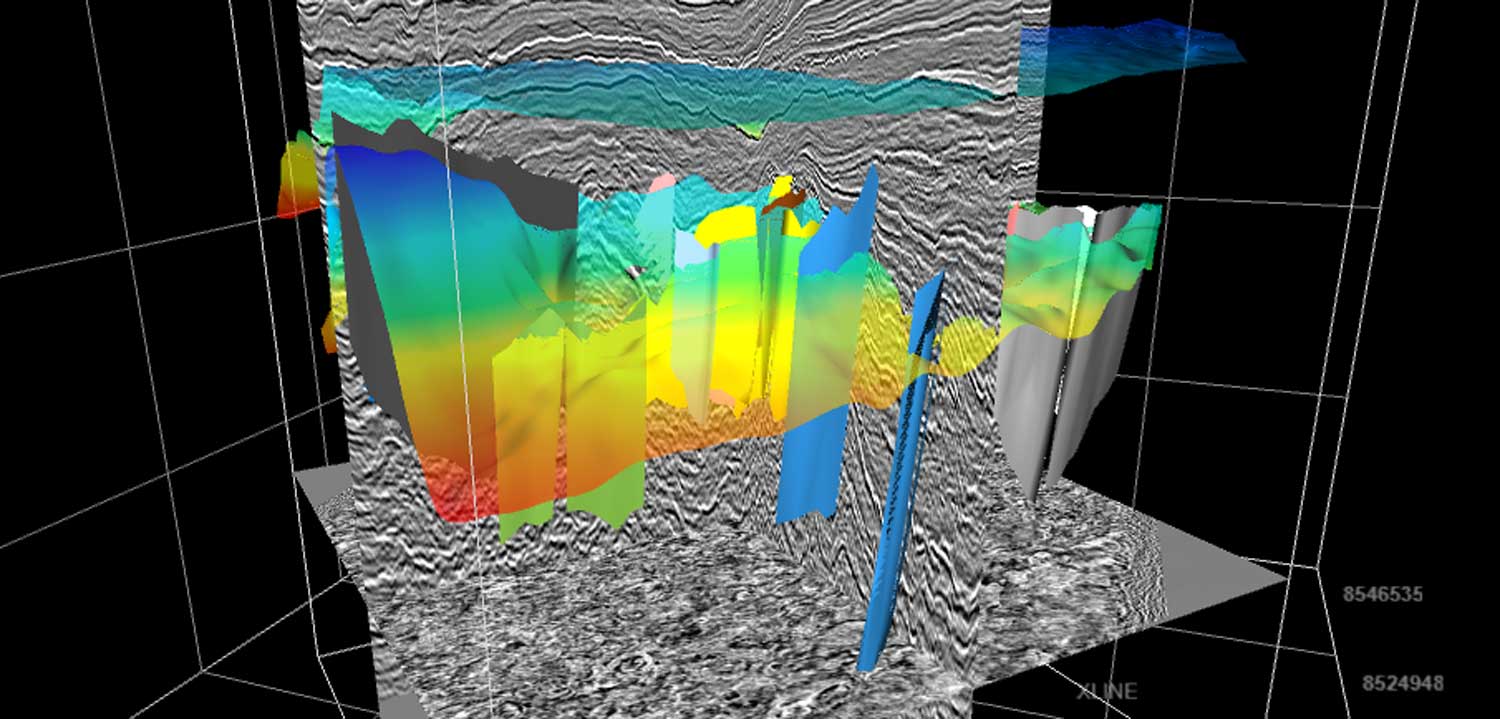
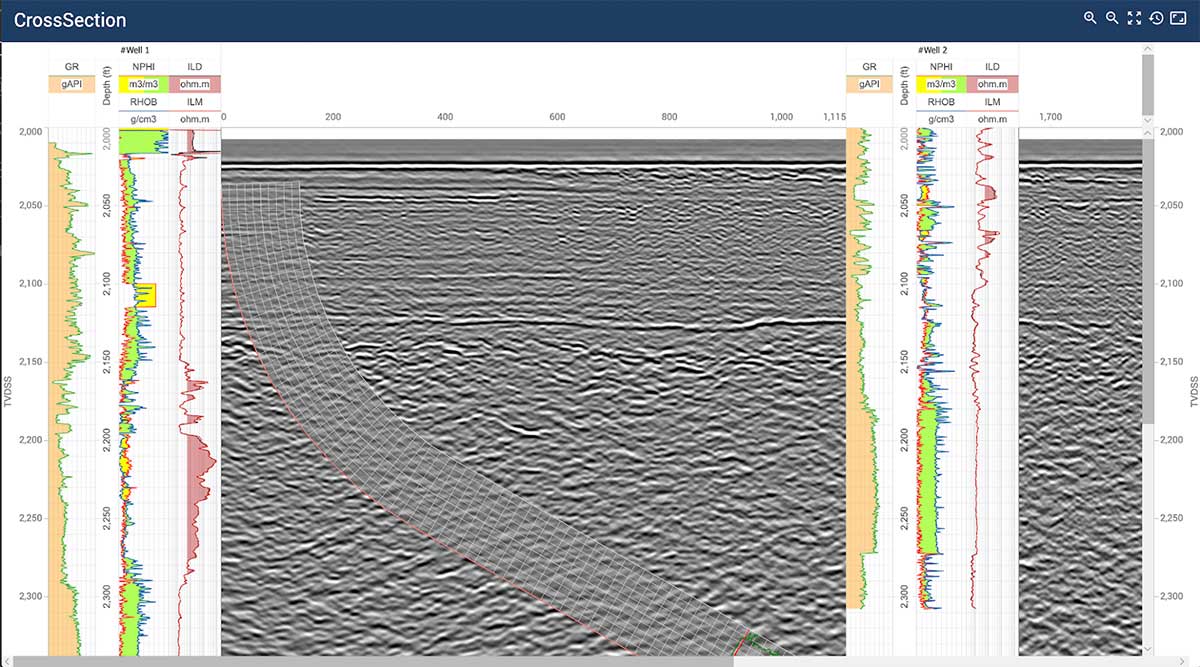
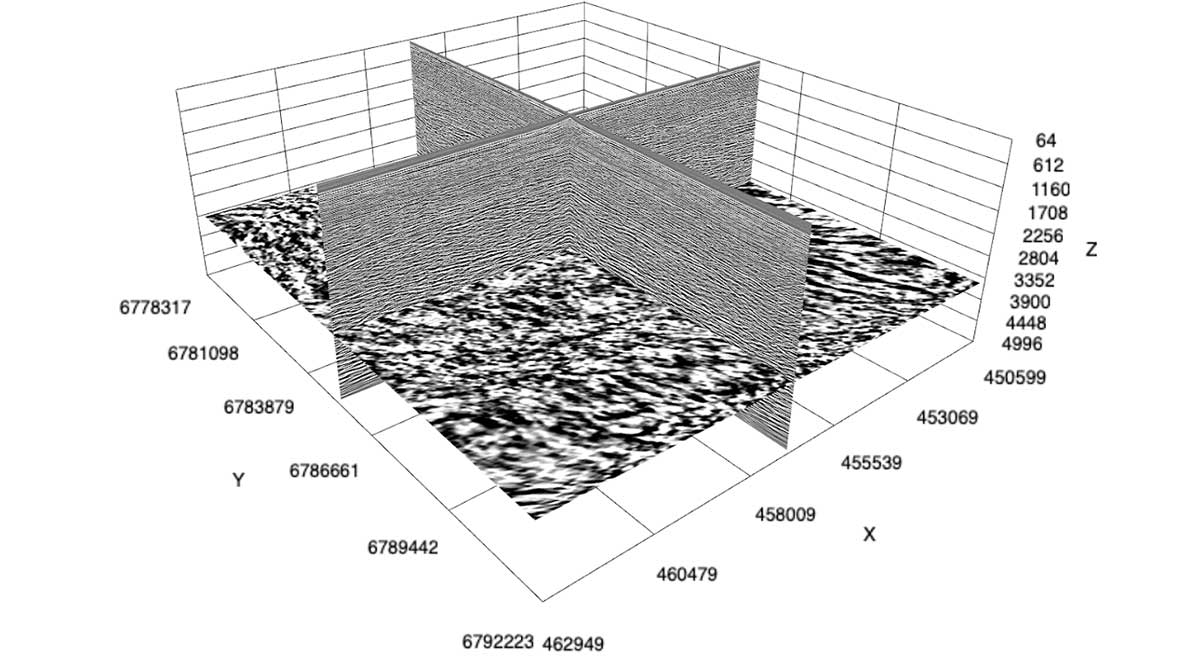
GeoToolkit’s latest updates improve and extend functionality, from 3D to schematics and maps to seismic visualization. GeoToolkit’s 3D visualization now includes a vertical plane to show horizon/fault intersection, and contour labeling. The release adds a new deviated schematics widget, along with the ability to display perforations, schematics, casing and casing shoes in 3D.
This GeoToolkit.JS 2021 release also includes map features to help take visualization to the next level, adds a new overlay that supports HTML elements and model positions, extends support for additional ArcGIS services, and improves the text styles for map scale objects. These improvements make it easier to customize maps with rich data to support analysis and exploration workflows.
“Visualization is key to understanding and unlocking insights from your data science — whether those insights are in exploration of traditional energy sources or in a new energy domain,” said Dr. Dmitriy Lukyanenko, INT’s Director of Software Development. “INT consistently finds new ways to innovate, to offer new solutions for our clients as they navigate the digital transition happening throughout the industry.”
Read the press release on PRWeb.
To learn more about GeoToolkit.JS 2021, please visit int.com/products/geotoolkit/ or contact us at support@int.com.
____________
ABOUT INT:
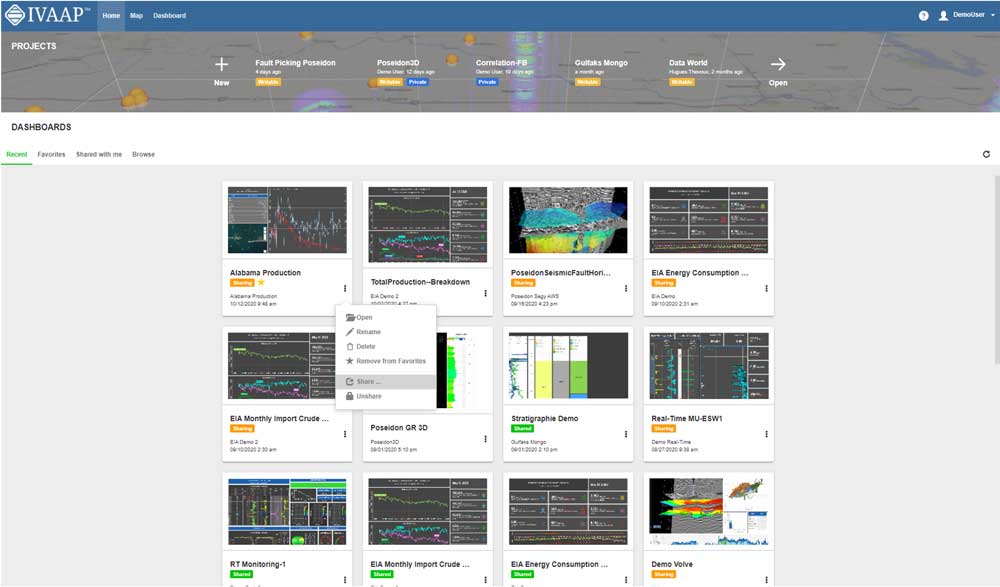
INT software empowers the largest energy and services companies in the world to visualize their complex subsurface data (seismic, well log, reservoir, and schematics in 2D/3D). INT offers a visualization platform (IVAAP) and libraries (GeoToolkit) developers can use with their data ecosystem to deliver subsurface solutions (Exploration, Drilling, Production). INT’s powerful HTML5/JavaScript technology can be used for data aggregation, API services, and high-performance visualization of G&G and petrophysical data in a browser. INT simplifies complex subsurface data visualization.
For more information about GeoToolkit or INT’s other data visualization products, please visit https://www.int.com.
INT, the INT logo, and GeoToolkit are trademarks of Interactive Network Technologies, Inc., in the United States and/or other countries.