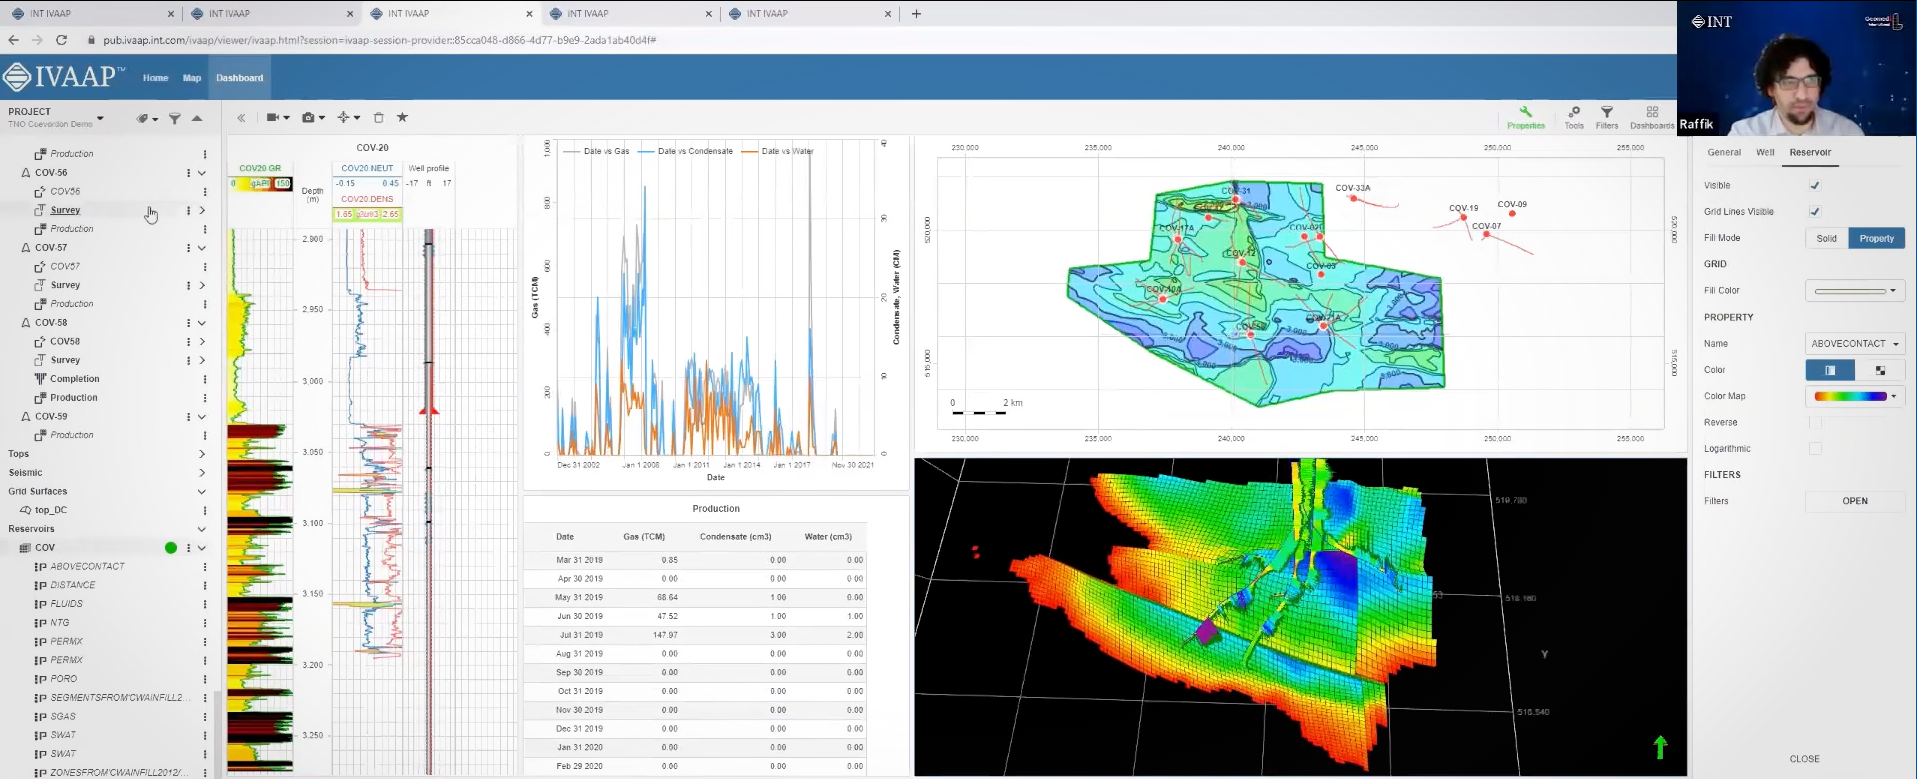
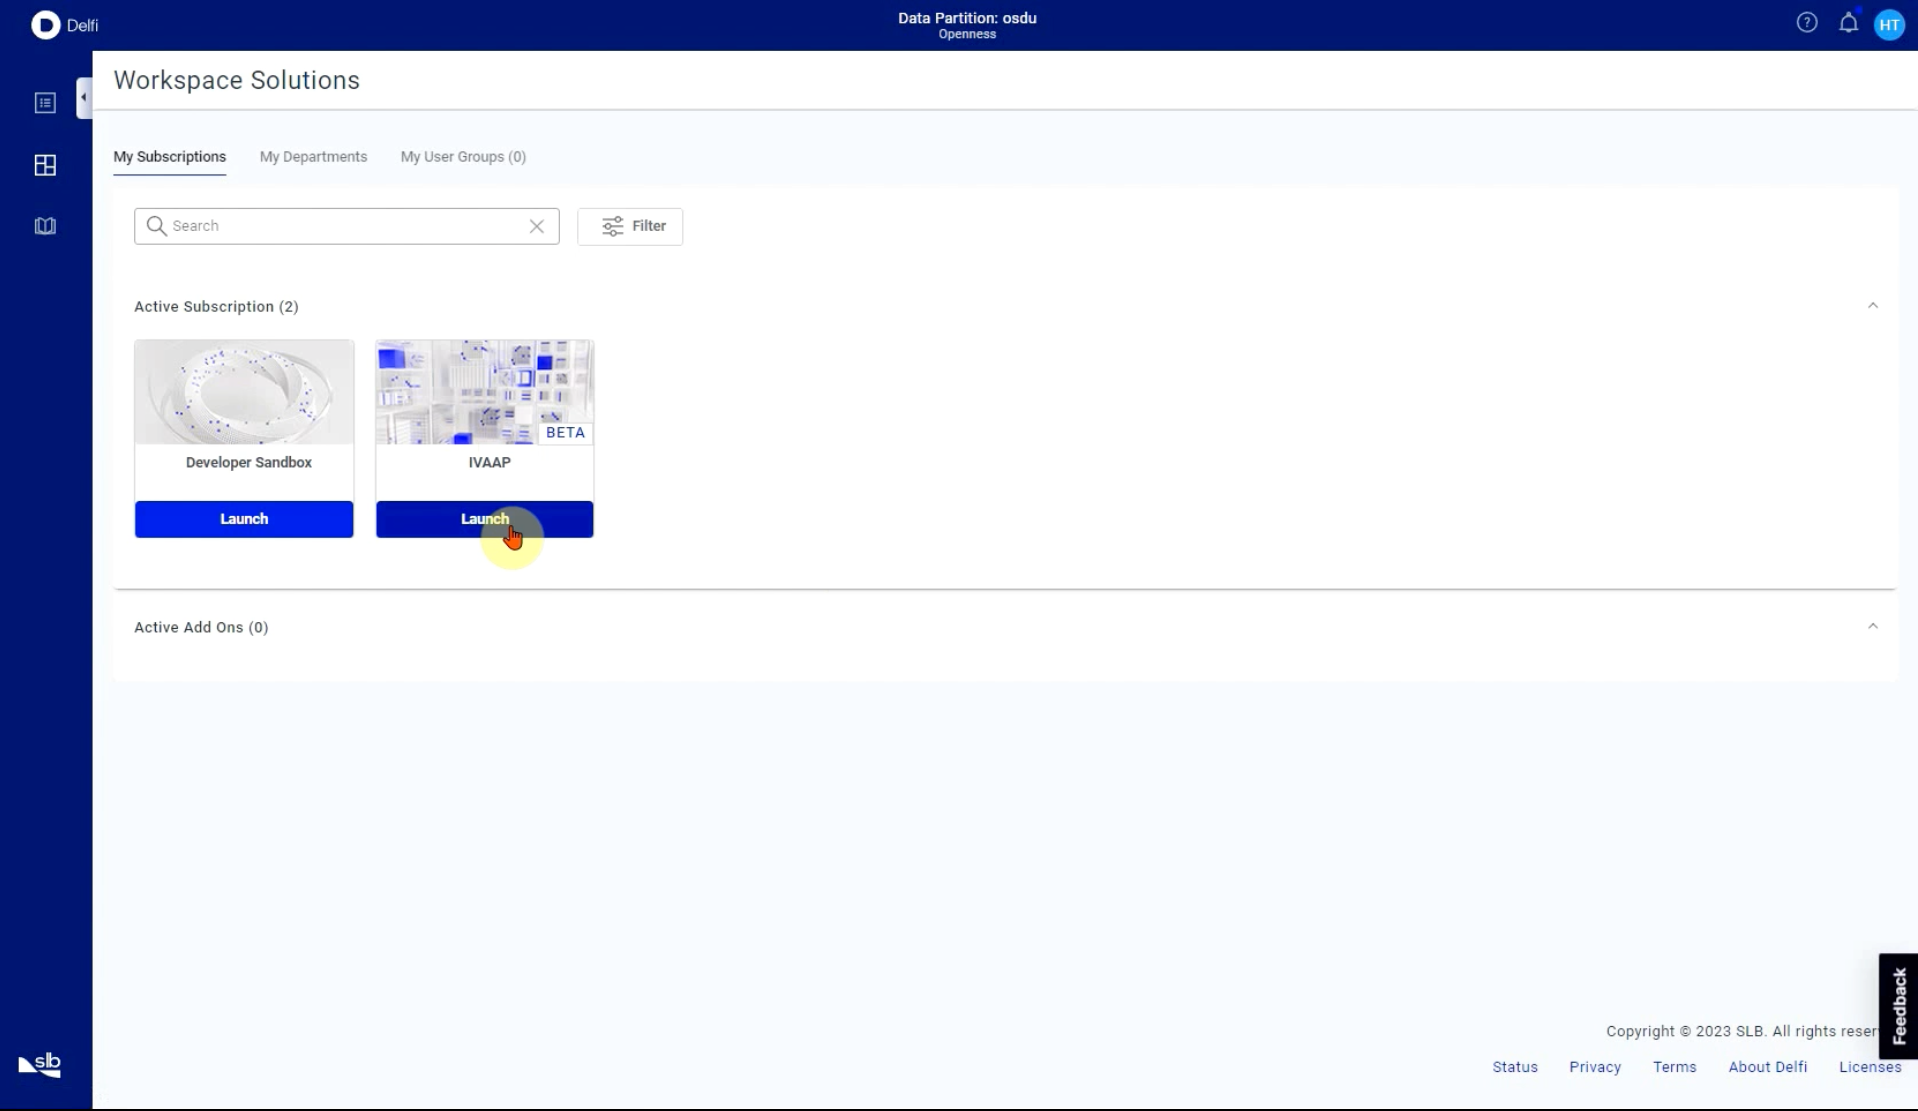
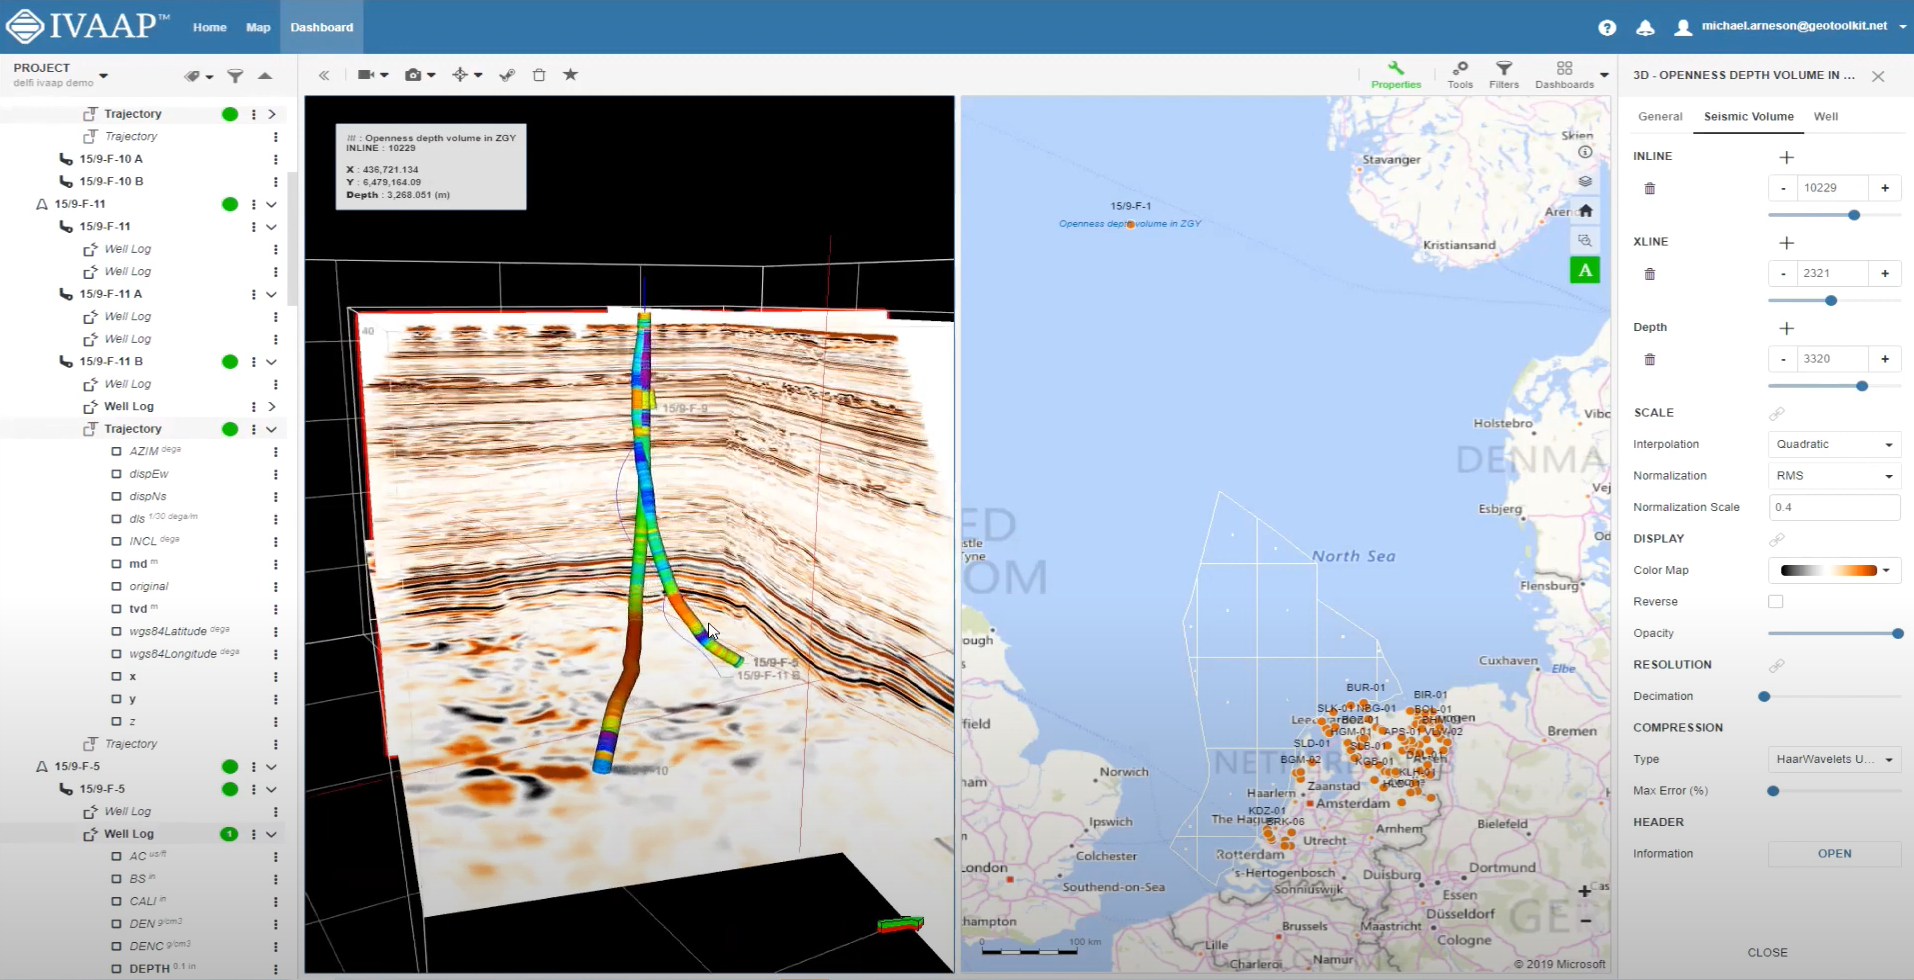
• Skip to main content
  • Skip to footer

INT

Empowering Visualization

CONTACT US SUPPORT
MENUMENU
  • Products
    • Overview
    • IVAAP™
    • INTViewer™
    • GeoToolkit™
    • Product Overview
  • Demos
    • GeoToolkit Demos
    • IVAAP Demos
  • Success Stories
  • Solutions
    • Overview
    • For E&P
    • For OSDU Visualization
    • For Cloud Partners
    • For Machine Learning
    • For CCUS
    • For Geothermal Energy
    • For Wind Energy
    • For Enterprise
    • Tools for Developers
    • Services Overview
  • Resources
    • Blog
    • Developer Community
    • FAQ
    • INT Resources Library
  • About
    • Overview
    • News
    • Events
    • Careers
    • Meet Our Team
    • About INT

Products

Jan 19 2022

An Inside Look at the New Release of the IVAAP Data Backend SDK

INT recently announced the release of IVAAP 2.9. We sat down with Thierry Danard, INT’s VP of Core Platform Technologies, for a quick chat about what this release includes for the Data Backend SDK.


Hi Thierry, what can you tell us about IVAAP 2.9 for the Data Backend?

There are a few low-level changes that won’t make it to the release notes, but that will make a difference for users. For example, we optimized the data caching mechanism. Instead of being based on the number of datasets, the data caches are now based on the size of these datasets. This typically means lower latency as more datasets tend to be cached within the same memory space. This is a feature we initially used only with WITSML wells that we have extended to other connectors and data types.

At a high level, we added a powerful “tiled images” feature. Some INT customers have large rasters that they need to visualize, or that their customers need to visualize as part of a portal. These images are stored as good old TIFF image files on a local file system or in the cloud. To visualize these images in IVAAP, you just need to point at the location of these tiles, and IVAAP does the rest. While the idea of visualizing images online might seem mundane, there is quite a lot of technology to make this happen.

First, these image files are LARGE. They can be up to 4 GB in TIFF format, and that’s a compressed format! To make the visualization of these images seamless, you need to be really good at:

  1. Downloading these files from the cloud, fast
  2. Reading these images in their native format
  3. Rendering these images as small tiles and sending these tiles to the viewer efficiently
  4. Stitching these images back together as one raster on the viewer side
  5. Caching these images long enough, but not too long
  6. Doing all this concurrently, for a large number of simultaneous users

That’s the technology side of it. From a business perspective, what’s really interesting is that there is no preprocessing of the images required. The ingestion workflow requires no specialized tooling. There’s no need to “precut” each TIFF as multiple tiles at multiple resolution levels. The “cutting” is all done on the fly and it’s seamless to end users. This is particularly important to keep storage to a minimum when you migrate your image library to the cloud. When each TIFF file takes gigabytes, a library of only a few thousand files already has a significant footprint, so you don’t want to expand that footprint with file duplication.


Is this image tiling feature something I could use for my own image storage?

Yes. The technology we developed makes abstraction of the storage mechanism possible. The reading, cutting, rendering, and caching are part of the IVAAP Data Backend SDK’s API. You can reuse these parts in your code.


What’s the purpose of this SDK, and how does it apply to images?

One of the strengths of IVAAP is that it allows the visualization of data from multiple data sources. For example, just for visualization of wells, IVAAP supports Peloton WellView, PPDM, WITSML, LAS files in the cloud, etc. These data sources typically share a common data model, but what’s different between them is the medium or protocol to access this data. The typical use case of the IVAAP Data Backend SDK is to facilitate the implementation of that access layer.

Images are treated as data. Just like we have “well” web services, we have “image” web services. The image web services are generic in nature—it’s the same service code running regardless of their underlying storage mechanism. It’s only the access code that differs. As a matter of fact, we implemented access to four types of image stores on top of our SDK:

  • Images stored locally on disk
  • Images stored in Amazon S3
  • Images stored in Microsoft Azure Blob Storage
  • Images stored in Google Cloud Storage

In this particular example, we used our own SDK to develop both the data layer and the web service layer.


Is the IVAAP Data Backend SDK a web framework?

While this SDK does provide an API to create your own web services, it goes well beyond that. If you call the IVAAP Data Backend SDK a framework, then it’s a highly specialized framework. And it’s not just a web framework, it’s also a data framework. Also, web frameworks tend to force you into a container. To scale your application, you are limited by the capabilities of this container. The IVAAP Data Backend SDK abstracts the container away, giving customers multiple options for how to deploy it and scale it.

From a technical perspective, a good SDK should empower developers. Often, this means requiring the least amount of effort to get the job done. From a business perspective, a good SDK should reduce development costs. Calling the IVAAP Data Backend SDK “yet another web framework” is missing the point of its value. Its value is not about doing the same thing as your favorite “other framework,” it’s about fitting your use case in the most effective way.


Then … how is the IVAAP Data Backend SDK a good fit?

Obviously, the integration with the rest of IVAAP is a strong benefit. You could write your data access object (DAO) layer using the API of your choice, but you would still need to write more mundane aspects, such as:

  • Exposing this data in a REST API, following the exact protocol that the IVAAP client expects. There would be hundreds of REST services to implement.
  • Integrating with services from the Admin server. For example, how users are identified, how to find out who has access to what, what are the datasets within a project, etc.

The second fit is that the SDK is designed to work with geoscience data. It integrates the data models of multiple data types, such as wells, seismic, surfaces … and raster images. While the IVAAP Data Backend SDK can be used outside of a geoscience context, a good portion of its API is geoscience-specific.

During design, we were particularly careful not to make any assumptions about how our customers’ geoscience data is stored. No matter how exotic your data systems might be, the IVAAP Data Backend will be able to access them. We are not just talking about storage, we are also talking about real-time feeds and machine learning (ML) workflows. We verified this multiple times. One particularly visible example is OSDU. INT has been on the leading edge of OSDU development, following the multiple iterations or flavors of OSDU services without requiring a change to our SDK.


How is the IVAAP Data Backend SDK effective?

Its API is quite simple to learn. Multiple INT customers have used this SDK to develop their own IVAAP customizations, and its API has always been well received. One aspect that is particularly liked is the lookup architecture. Plugging a class requires no XML, just one Java annotation, and it’s the same annotation used across the entire API. It’s an elegant mechanism, easy to learn, and even easier to use.

The real proof of the IVAAP Data Backend SDK’s effectiveness is the time it takes external developers to learn it and develop their own connector. We tested the effectiveness of the SDK by asking new hires to develop a connector, only armed with their knowledge of Java. Without any prior geoscience knowledge, the average time to get that connector up and running has been 2 weeks.

Another way that the backend keeps developers effective is by not taking away their favorite development tool. While the IVAAP Data Backend uses a powerful cluster architecture in production deployments, the typical developer’s day is with their favorite IDE (NetBeans, Eclipse, IntelliJ, etc.) and a well-known application server (Tomcat, Glassfish). Development is much faster when you don’t need to launch an entire cluster for a simple debugging session.

Effectiveness and fit are key. The goal of a typical framework is to help you get started faster. It provides a shortcut to skip the implementation of the mundane concerns of an application. In IVAAP’s case, for many customers, the application itself is already written. For these customers, the IVAAP Data Backend SDK helps you get finished faster instead. It provides customers with the API to finish the last mile of an IVAAP deployment, the access layer to their proprietary data store.

For more information or for a free demo of IVAAP, visit int.com/products/ivaap/.


Filed Under: IVAAP Tagged With: backend, data, IDE, image, ivaap, OSDU, raster, SDK, TIFF

Jan 07 2022

INT Advances IVAAP as Universal Subsurface Cloud Viewer with Full OSDU™ Data Platform Support

Empower energy users’ experience by embedding advanced subsurface data visualization with your data science in your digital solutions.

INT, a leading provider of data visualization software, just announced the newest version of their universal subsurface visualization and analytics application platform, IVAAP™. Offering full OSDU Data Platform support, IVAAP 2.9 enables exploration, visualization, and computation of energy data. The new release also expands IVAAP’s map-based search, data discovery, and data selection with 3D seismic volume intersection, 2D seismic overlays, reservoir, and basemap widgets to visualize all energy data types in the cloud.

As an OSDU-native application, IVAAP can accelerate the integration between the OSDU Data Platform and other EDM platforms. For example, INT recently partnered with Halliburton Landmark to demonstrate the power of interoperability between systems — linking IVAAP to Landmark EDM through the OSDU Data Platform on AWS. 

A major new feature of IVAAP is its integration capabilities with processing or machine learning services. This new capability was added in response to many energy companies who had many algorithms and models in various programs — Python, TensorFlow, Jupyter notebooks, to name a few — spread across the organization and were faced with the challenge to share them and make them accessible in other apps. With this new capability, IVAAP accelerates workflow integration and simplifies Machine Learning Operations (MLOps). 


“We’ve been working to fully integrate new features in IVAAP that can streamline user workflows, reducing time to decision and empowering users with data visualization to help them to collaborate, make strong, accurate business decisions, and otherwise improve their ability to work with subsurface data for energy,” said Olivier Lhemann, president of INT. “With this release, we bring that full circle — users can now access their data using the power of the OSDU Data Platform, perform machine learning and processing models, and visualize the results.”


IVAAP’s workflow integration opens up a brand new user experience where now data scientists, modelers, geophysicists, and data managers can search data in the cloud, select data of interest, and launch computation from a single platform. IVAAP is providing new ways for operators, services, and energy technology software providers to enrich their digital solutions with powerful visualization and integration capabilities to OSDU Data Platform and machine learning for further automation. 

Learn more about IVAAP at int.com/ivaap.

For more information, please visit www.int.com or contact us at intinfo@int.com.


Filed Under: IVAAP Tagged With: 3D, basemap, ivaap, machine learning, ml, OSDU, seismic, workflows

Dec 08 2021

Latest Release of INT’s GeoToolkit.JS Brings More Advanced Features to Develop the Next Generation of Energy Applications

The GeoToolkit.JS 2021.1 release innovation includes new Live Code Sandbox, new features in Schematics and Seismic libraries, and optimized display of 3D Reservoir in a web browser.

Houston, TX — INT’s latest release of GeoToolkit.JS data visualization libraries and toolkit integrates many new features, including new live code sandbox, 3D reservoir optimization, schematics customization capabilities, faster TIFF and raster log rendering, time series customization, and more.

With the new live code playground, developers can work with GeoToolkit code in real time, instantly testing their customizations and iterating quickly to fine-tune functionality.

Developers can use the new dual schematics widget which shows/compares two states of schematics in GeoToolkit.JS to implement more complex visualizations, such as planned versus actual drilling. And features like the added horizon intersection for seismic time slice add a layer of context to seismic visualization.

INT is constantly looking at improving performance, adding new functionality, and helping developers enhance the UX experience. But INT is not limiting its technology to the client side. For large datasets, like seismic, reservoir, or big images, the visualization and the web services are tightly coupled so that only a minimum amount of data is sent based on the viewport and the LOD (Level Of Detail).


“We work closely with our users to understand and incorporate their needs within our products. With this GeoToolkit release, we delivered more features and improvements that will further expand our users’ capabilities so they have what they need to customize, build, and deliver their advanced web-based, exploration, drilling and production applications,” said Dr. Olivier Lhemann, President of INT.


GeoToolkit.JS 2021.1 also includes capabilities such as improved TypeScript headers, generation and API reverence, revisited reports generation, and more.

RELEASE HIGHLIGHTS:

  • Live code sandbox — Run tutorials in live code sandbox to test functionality
  • Raster Logs and Cloud TIFF Rendering — Server downloads image from cloud, unpacks TIFF image, copy and scale requested tile, convert image to byte array, send bytes array
  • 3D Reservoir Optimization and Intersection with Seismic — Optimized reservoir grid with anti-aliasing and improved reservoir performances by filtering cells by IJK/value and neighbor occlusion, intersection of reservoir grid with seismic, and improved seismic intersection points performance and fix interpolation color
  • Time Series Styles and Customization — Added barchart mode to TimeSeriesWidget and improved auto limits calculation for TimeSeriesWidget
  • Creating PDF Reports with Multiple Widgets — New set of tutorials, CSS support to Document and DocumentViewWidget, virtual DOM
Widgets integration, added text alignment in cell, added page header/footer support, CSS Pseudo-classes, CSS borders, CSS margins

For more information about GeoToolkit.JS or INT’s other data visualization products, please visit www.int.com or contact us at intinfo@int.com.

Read the press release on PRWeb.

To learn more about GeoToolkit.JS 2021, please visit int.com/products/geotoolkit/ or contact us at support@int.com.

____________

ABOUT INT:

INT software empowers the largest energy and services companies in the world to visualize their complex subsurface data (seismic, well log, reservoir, and schematics in 2D/3D). INT offers a visualization platform (IVAAP) and libraries (GeoToolkit) developers can use with their data ecosystem to deliver subsurface solutions (Exploration, Drilling, Production). INT’s powerful HTML5/JavaScript technology can be used for data aggregation, API services, and high-performance visualization of G&G and petrophysical data in a browser. INT simplifies complex subsurface data visualization.

For more information about GeoToolkit or INT’s other data visualization products, please visit https://www.int.com.

INT, the INT logo, and GeoToolkit are trademarks of Interactive Network Technologies, Inc., in the United States and/or other countries.

Filed Under: GeoToolkit, GeoToolkit (Geoscience), JavaScript, Press Release Tagged With: cloud, energy, oil and gas, subsurface data visualization, time series

Nov 30 2021

INT Achieves AWS Energy Competency Status

This announcement highlights INT as an AWS Partner with deep industry expertise and follows a rigorous technical validation process and customer reference audit.

INT announced today that it has achieved Amazon Web Services (AWS) Energy Competency status. This designation recognizes that INT has demonstrated deep expertise helping customers leverage AWS cloud technology to transform complex systems and accelerate the transition to a sustainable energy future.

Achieving the AWS Energy Competency differentiates INT as an AWS Partner with deep expertise and technical proficiency within this unique industry, including proven customer success developing solutions across the value chain, from production operations and optimization to new energy solutions, and more.

To receive the designation, AWS Partners undergo a rigorous technical validation process, including a customer reference audit. The AWS Energy Competency provides energy customers the ability to more easily select skilled Partners to help accelerate their digital transformations with confidence.


“INT is extremely proud to achieve the AWS Energy Competency designation,” said Olivier Lhemann, President at INT. “Our team is dedicated to helping our customers accelerate their transformation to the cloud by leveraging our platform, IVAAP, which offers complex subsurface visualization, dashboarding, and collaboration capabilities—all accessed seamlessly in the cloud with AWS.”


AWS is enabling scalable, flexible, and cost-effective solutions from startups to global enterprises. To support the seamless integration and deployment of these solutions, AWS established the AWS Competency Program to help customers identify AWS Partners with deep industry experience and expertise.

INT helps energy companies accelerate the development of energy digital solutions by embedding complex data visuals with IVAAP visualization platform in the cloud. INT works closely with over 100 energy companies such as TGS, a provider of a diverse range of Energy Data for more than 40 years.


“Our partnership with INT and the integration of IVAAP with our ecommerce/cloud platform allowed us to greatly reduce our time to market while delivering robust visualization tools that our clients wanted,” said Jim Burke, Software Development Manager at TGS. “Now, our clients can not only visualize log data, but they can also perform analytics—all on AWS.”


Filed Under: IVAAP Tagged With: AWS, energy, ivaap

Jul 29 2021

Intel OpenVino and IBM Red Hat Select IVAAP to Demonstrate the Power of New Hybrid Cloud OSDU Data Platform

This offering powers a unified environment to drive AI, accelerated data analytics, and high-performance computing (HPC) integrated with IVAAP Data Visualization platform.

IBM and Red Hat joined forces to deliver the only market-ready hybrid cloud implementation of the OSDU Data Platform. Additionally, Intel, IBM, and Red Hat are teaming up to deliver a fully hybrid cloud-to-edge OSDU-enabled industry offering to power a unified environment to drive AI, accelerated data analytics, and high-performance computing (HPC). By leveraging Intel’s AI-optimized Xeon Processors with the Intel Open Visual Inference and Neural Network Optimization (OpenVINO) toolkit, operators can benefit from Intel’s performance optimizations built for OpenShift and IBM Cloud Pak for Data.

The OpenVINO toolkit helps optimize computer vision inference models that use artificial intelligence and machine learning (AI/ML) on Intel platforms. It focuses on models that have already been trained, and applies capabilities learned after training a neural network to yield results. The Intel distribution of the OpenVINO toolkit enables the optimization, tuning, and running of comprehensive AI inference using the included model optimizer and runtime and
development tools.

Bringing to Life OSDU Seismic Interpretation Workflows from Intel/IBM Red Hat with IVAAP: A Demonstration on Salt and Fault Detection

Seismic interpretation—the tedious manual task of picking faults and horizons within sections to ultimately build an earth model that identifies proven hydrocarbons—is undergoing a fundamental shift. The application of AI/ML to uncover hidden patterns and correlations enables geoscientists to gain visibility into complex relationships between geologic features and seismic data. Because artificial neural networks learn by example and can solve problems with diverse, unstructured and interconnected data, deep learning (a subfield of ML) is an exciting technology for seismic interpretation.

As an example of the power of IBM Open Data for Industries, Intel and IBM have partnered with INT—a widely adopted oil and gas visualization software provider for more than 30 years—to deliver an end-to-end workflow using INT IVAAP for upstream data visualization.

IVAAP OpenSeismic salt dome formation

Thanks to its hybrid cloud foundations, this implementation of the OSDU Data Platform can easily be applied as a supervised deep learning approach to locating subsurface features, such as a salt dome. Deploying an optimized model generated from OpenVINO on the platform can accelerate the end-to-end seismic interpretation workflow.

In this example, the data was visualized using INT’s IVAAP to locate the seismic information by navigating through the IVAAP geospatial interface. Once the data is selected in the IVAAP project, it can easily be retrieved within the OSDU delivery API for use in a Jupyter Notebook where the OpenVINO libraries are available.

The seismic inference workflow integrates INT IVAAP visualization for the selection of a data and AI model, and integrates to an IBM Open Data for Industries instance within a Jupyter Notebook for inference processing. The inference results and statistics can be viewed within IVAAP visualization for quality inspection and analysis. This complete AI inference workflow—from the data and model elections up to display of inference results—can be easily leveraged to other data types and inference models. In addition, it can be extended through to additional subsurface inference workloads from data QC to interpretation and extrapolation. IVAAP can also be used to visualize facies characterization, data classification, log prediction, and more.

3D_seismic-dualscreen_small

The Power of Collaboration—and a Robust Visualization Solution—in the Cloud

As IBM, Red Hat, and Intel have shown, collaborations are key to driving success of the OSDU Data Platform—their shared goal is to make edge computing and connected hybrid clouds more secure, open, and flexible with complete interoperability.

To make the most of these interconnected functionalities, you need a robust, cloud-based front-end visualization that works with the OSDU platform to consume that data, launch and execute machine learning workflows, and visualize the results, all in one platform in the cloud.

To learn more about how IVAAP supports machine learning, visit int.com/solutions/machine-learning/ or to learn more about INT’s partnership with IBM, check out our press release.


Filed Under: IVAAP Tagged With: ai, IBM, ivaap, machine learning, ml, OSDU, redhat

  • « Go to Previous Page
  • Go to page 1
  • Go to page 2
  • Go to page 3
  • Go to page 4
  • Go to page 5
  • Interim pages omitted …
  • Go to page 16
  • Go to Next Page »

Footer

Solutions

  • For E&P
  • For OSDU Visualization
  • For Cloud Partners
  • For Machine Learning
  • For CCUS
  • For Geothermal Energy
  • For Wind Energy
  • For Enterprise
  • Tools for Developers
  • Customer Success Stories

Products

  • IVAAP
  • GeoToolkit
  • INTViewer
  • IVAAP Demos
  • GeoToolkit Demos

About

  • News
  • Events
  • Careers
  • Management Team

Resources

  • Blog
  • FAQ

Support

  • JIRA
  • Developer Community

Contact

INT logo
© 1989–2023 Interactive Network Technologies, Inc.
Privacy Policy
  • Careers
  • Contact Us
  • Search

COPYRIGHT © 2023 INTERACTIVE NETWORK TECHNOLOGIES, Inc