I have been using NetBeans daily for about 8 years, so I’d say I am pretty familiar … with the features I use all the time. Over the years, friends and colleagues have shown me that there are faster ways to get the job done. I have gathered in this post three shortcuts that I learned from others and that you can also use when you develop an INTViewer plugin.
#1 Finding a class file in the Project Tree
A software like INTViewer has thousands of source files, spread over dozens of plugins. As I am in the process of editing one file, I often find myself needing to find out which other files are related: I need contextual information about the file I am changing or I need to commit all changes to that module at once.
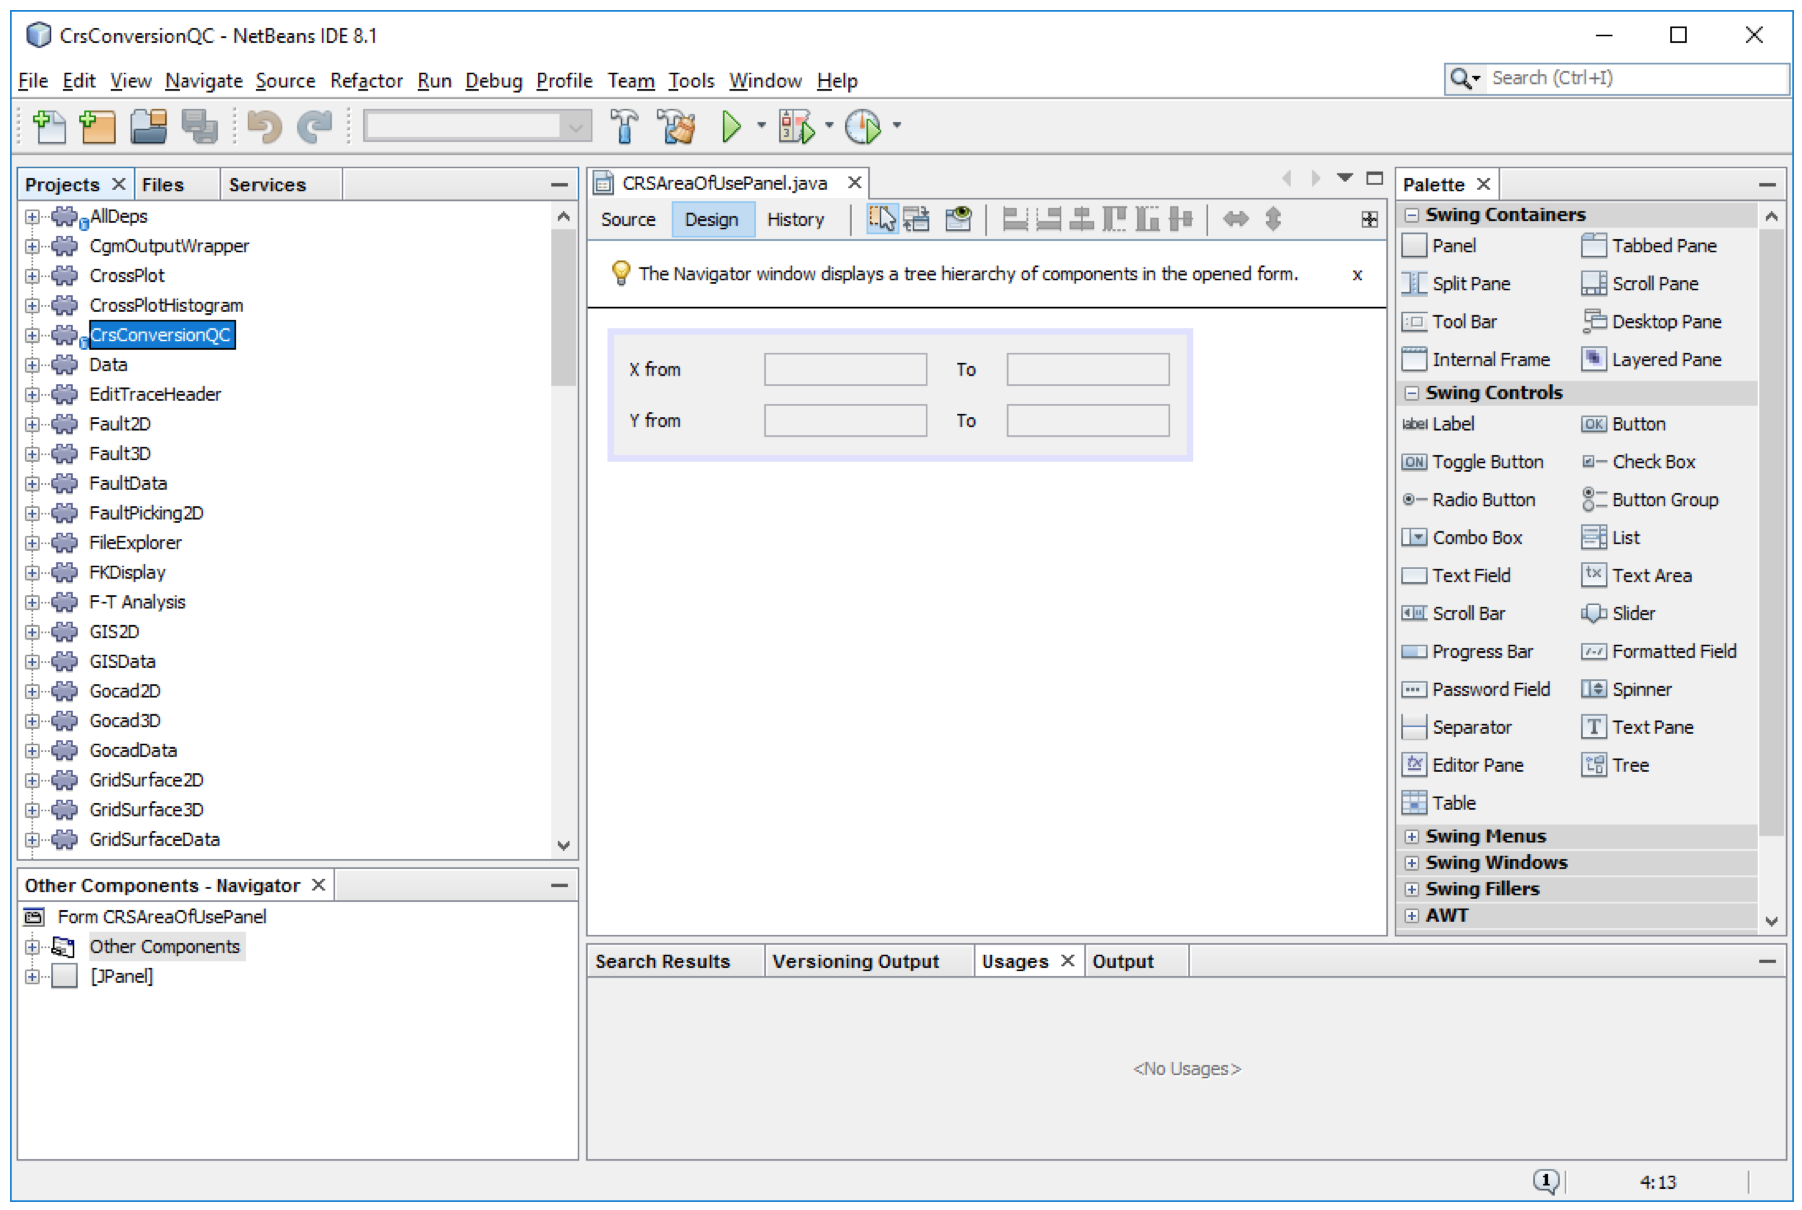
The shortcut to do this is to type Shift+Ctrl+1 on your keyboard.
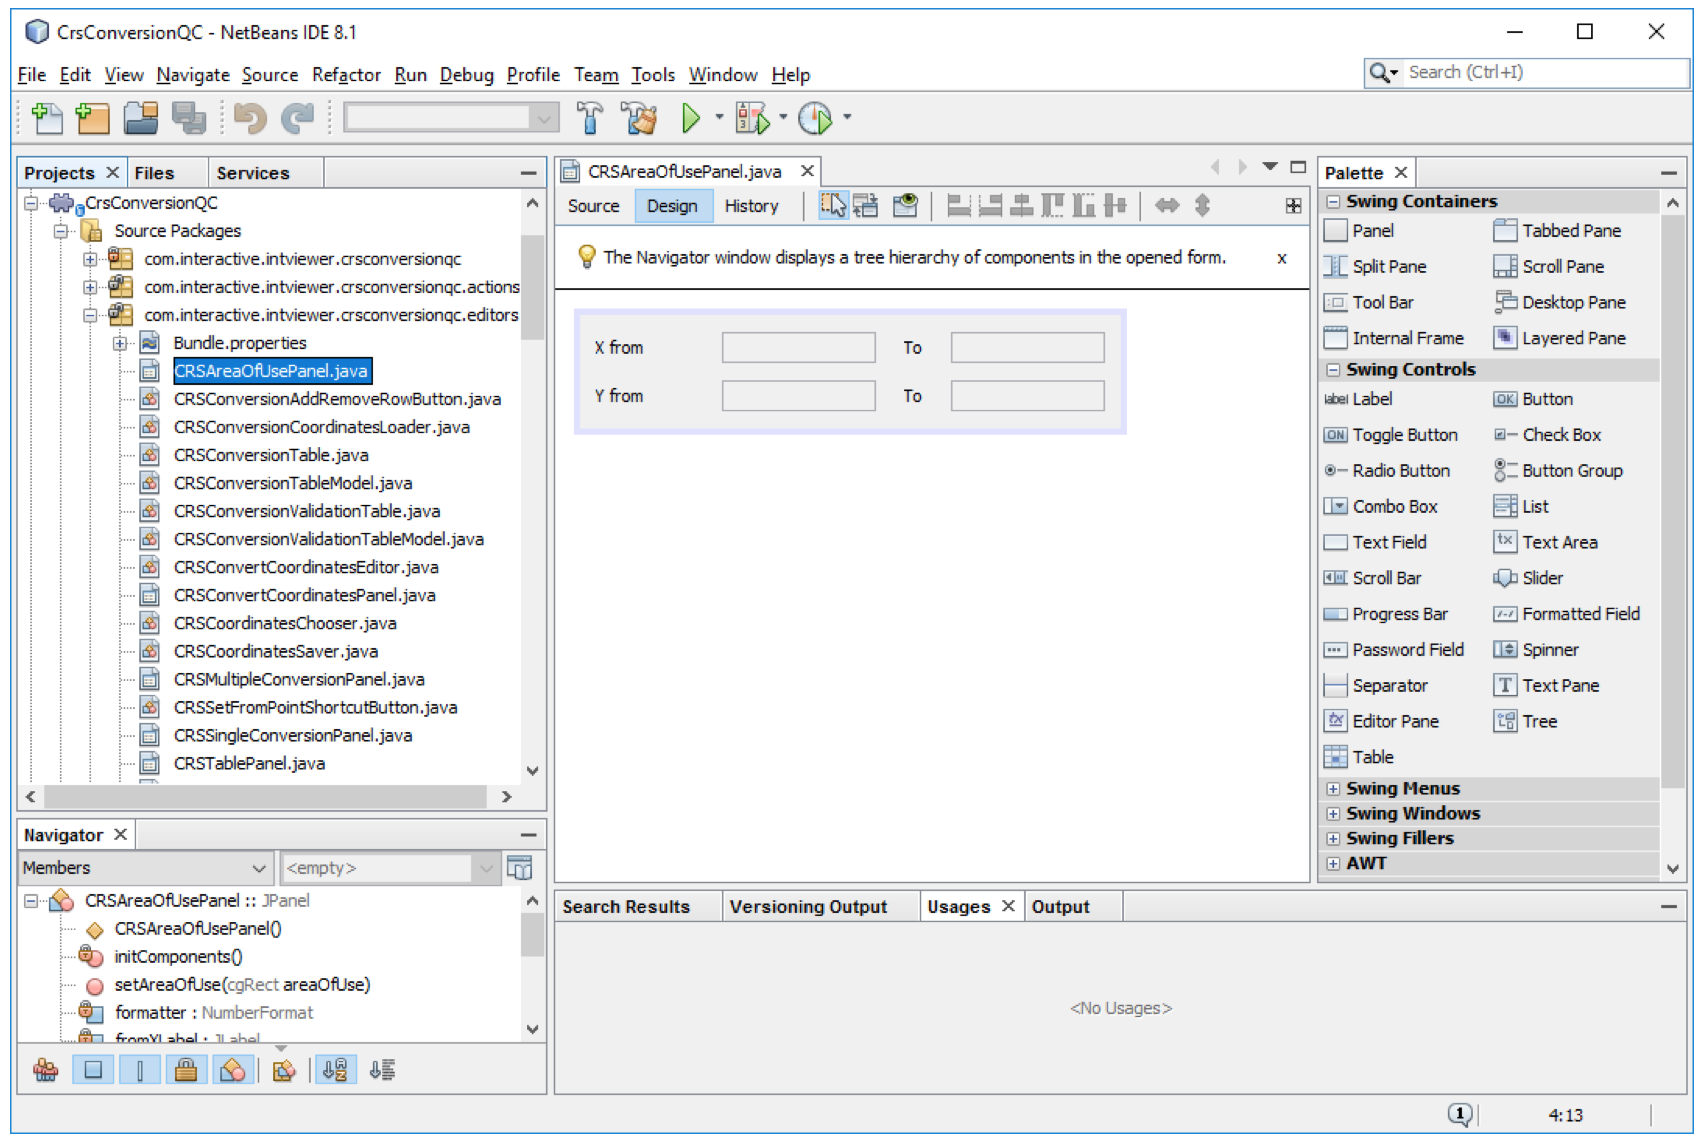
This shortcut opens both the package where the file resides and the module that contains that file.
#2 Closing all other files
The process of writing software is not a continuous flow. I work on several aspects of the software at the time, with lots of interruptions. Sooner or later, I have several dozens of unrelated files open. When I need to work on a tricky part of the code, the first task is to clear the clutter.
The NetBeans makes it easy: the “close button” of each NetBeans window has a handy tooltip that informs you of available shortcuts.
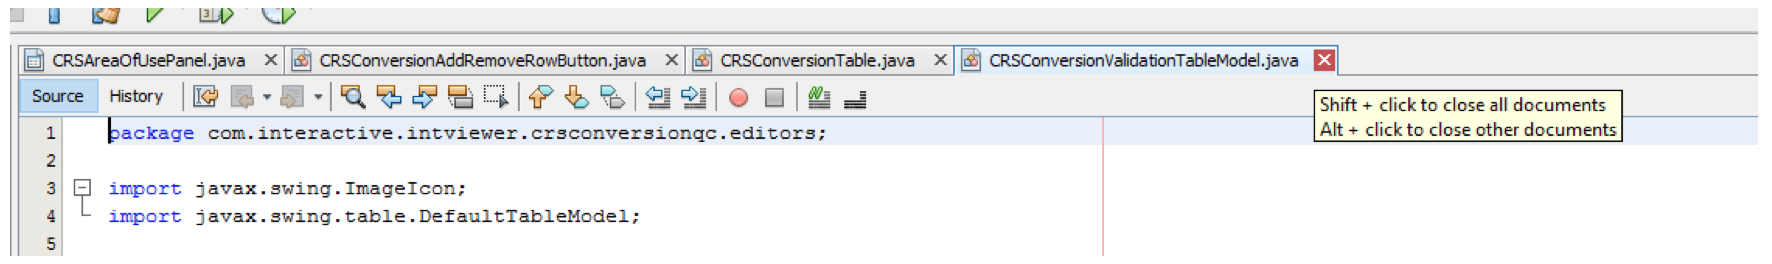
By pressing the Alt key as I am clicking this close button, I isolate the associated file, closing all other files that are open. I do this for each group of windows, and in 2 or 3 clicks, I reduced my clutter to the 2 or 3 files that matter.
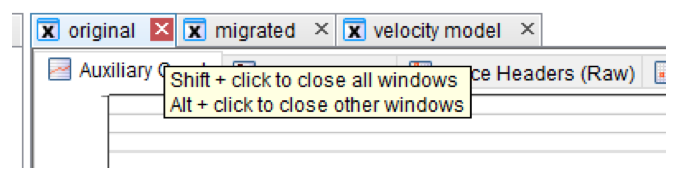
Interestingly, because INTViewer is based on the NetBeans platform, INTViewer users also benefit from the same feature. If I have several INTViewer windows open, I can click on the one window I want to keep, automatically closing all others in the same tab group.
#3 Loading already-configured projects
INTViewer itself is made of more than 80 plugins, but there are at least 50% more that are not part of the standard distribution. They are proprietary customer plugins, community plugins that we share with all our users, prototype plugins that we are working on. I sometimes need to run these plugins on top of the “bleeding edge” version of INTViewer’s code, sometimes on specific distributions that customers already use, sometimes on top of other plugins. The project configuration possibilities are endless, but I tend to use about 10 of these different configurations all the time.
NetBeans has a feature called Project Groups to facilitate switching between project configurations. To save your current project configuration, go to File→Project Groups. You will see a dialog with a button New Group that leads to the screen below:
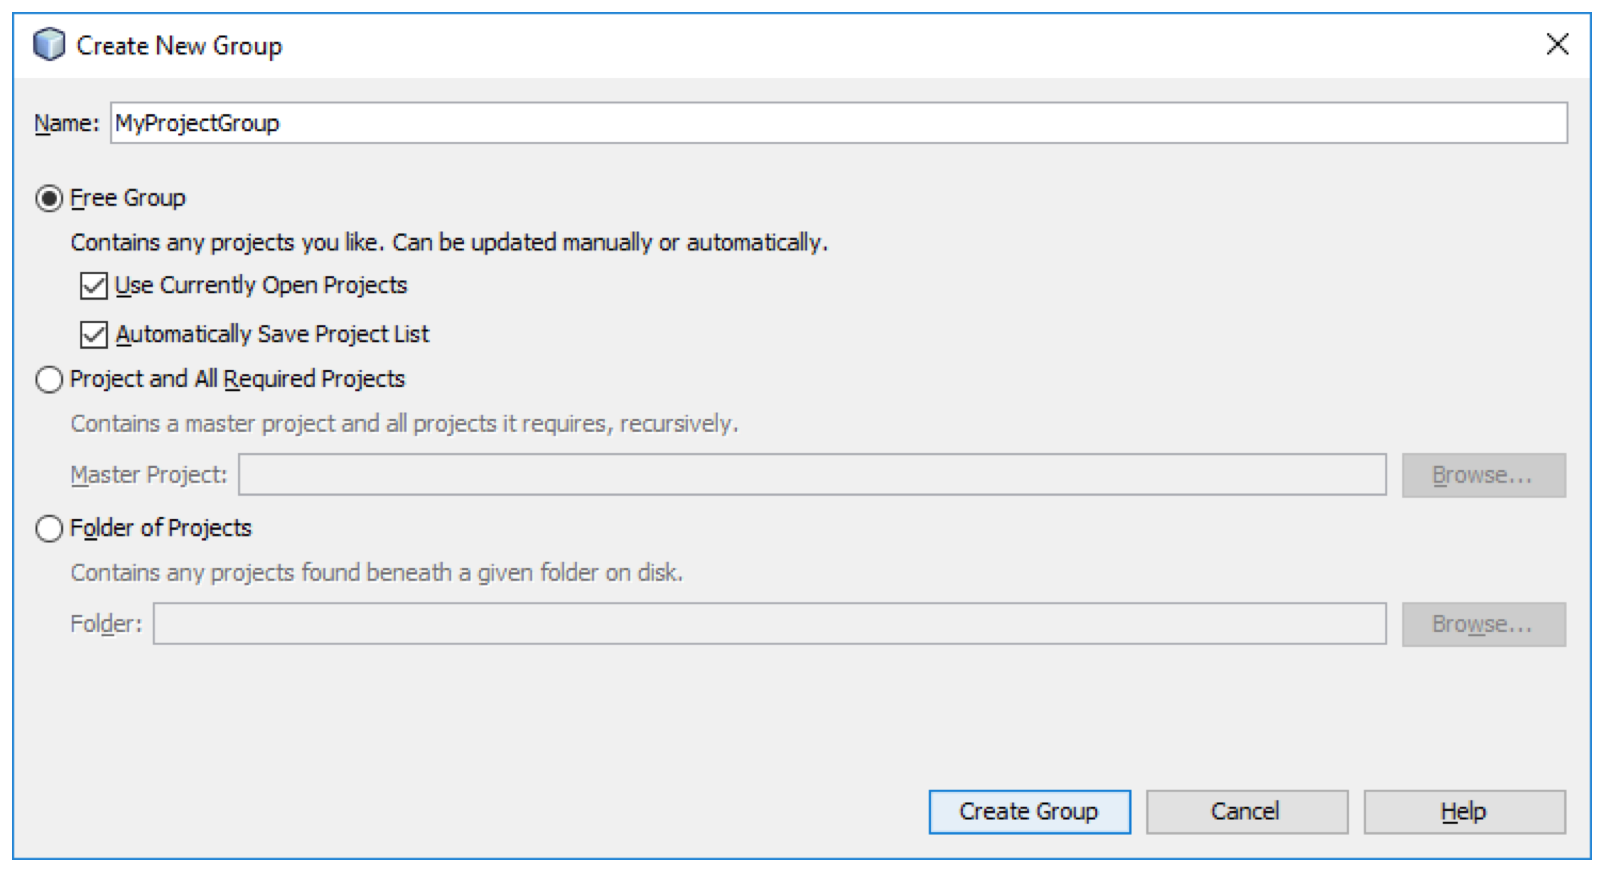
This dialog proposes several options on how to create your project group. I typically use the Free Group option and press the Create Group button.
To load a project group already created, go to File→Project Groups, pick the project group that you need to work on, and choose Select Group
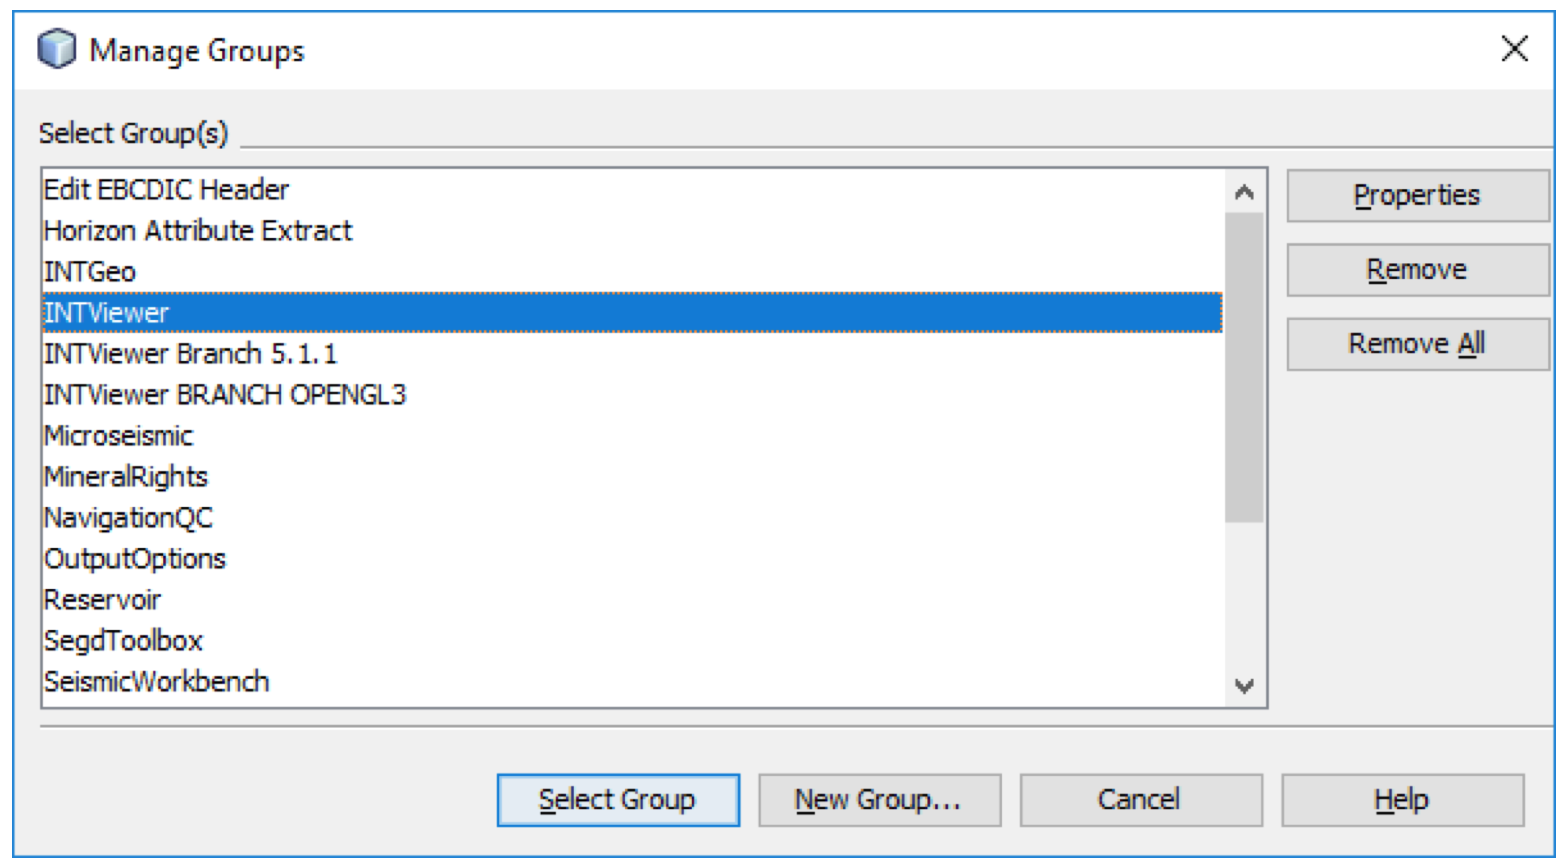
Your project tree will load exactly as you left it when you saved it as project group.