In our post, “Closer Look at Coordinate Conversions,” we allude to the capabilities of INTViewer with coordinate system conversions. One benefit of on-the-fly conversions is the ability to see your seismic data in context. In the example below, a time slice is reprojected to the coordinate system used by Google Maps.
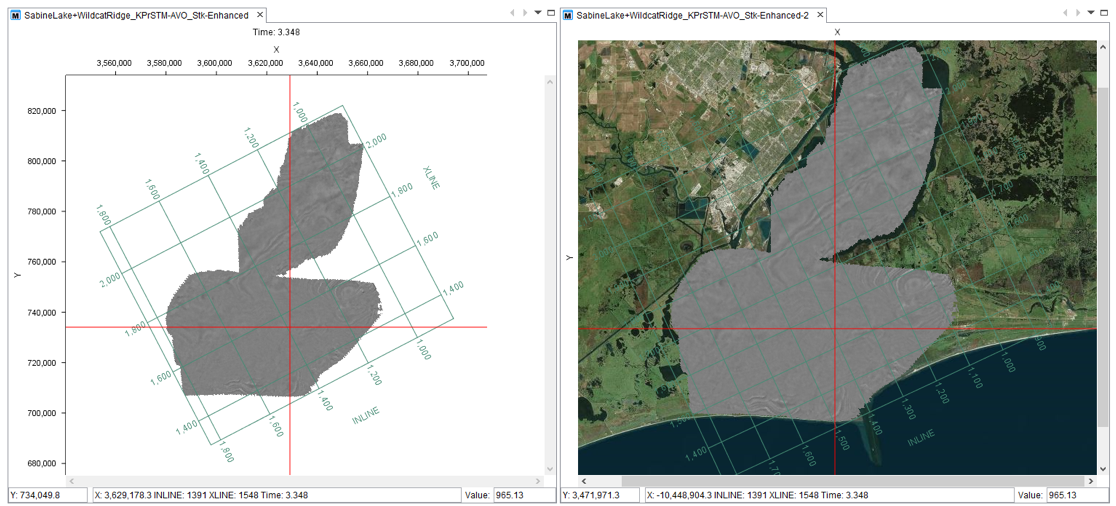
Showing satellite imagery is only one example of how you can use INTViewer to verify the geolocation of a seismic survey. INTViewer can visualize much more than seismic, and our customers often use INTViewer to compare seismic survey with shape files.
In the example below, the seismic is delimited in two regions, and each of these regions is delimited by a shape file.
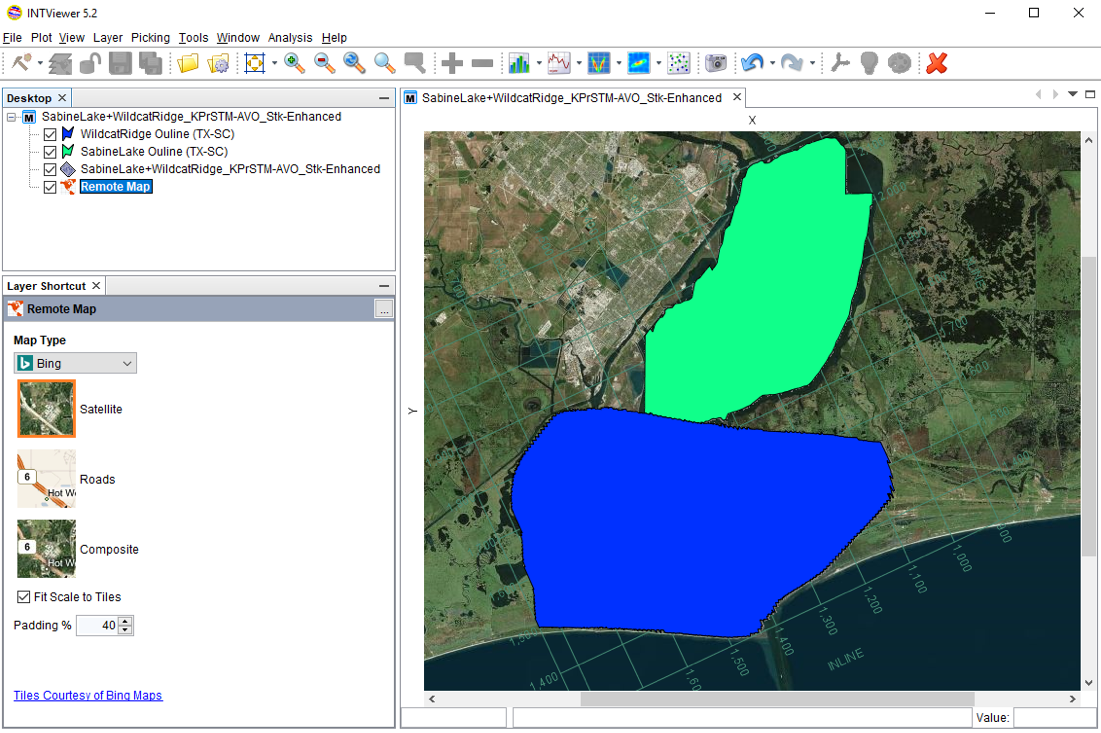
The most basic shape files consist essentially of polygons. Each point of this polygon has coordinates relative to a CRS. The shape files in this example are referencing the NAD27 coordinate system. INTViewer automatically converts NAD27 locations to the CRS used by Google Maps, making it possible to view several datasets in the same map window.
Similar to layers in Adobe Photoshop, each dataset has its own layer. Layering allows you to visualize several objects at one, while keeping independent control of each object. This concept is used across the entire INTViewer experience to allow users to overlay data.
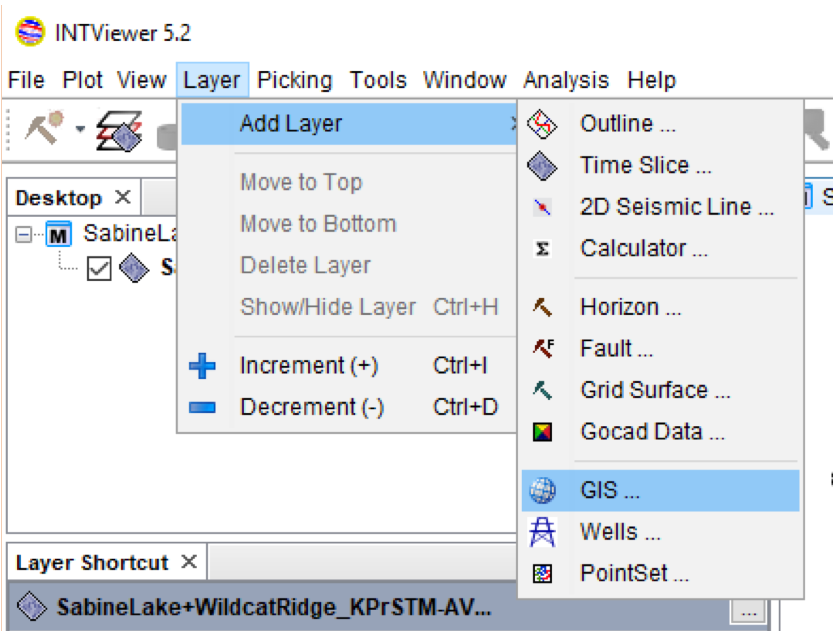
When users start a new session, they typically open the dataset from the File menu. Then, to overlay data, they select the Layer → Add Layer menu. For example, to produce the screenshot below, you would first:
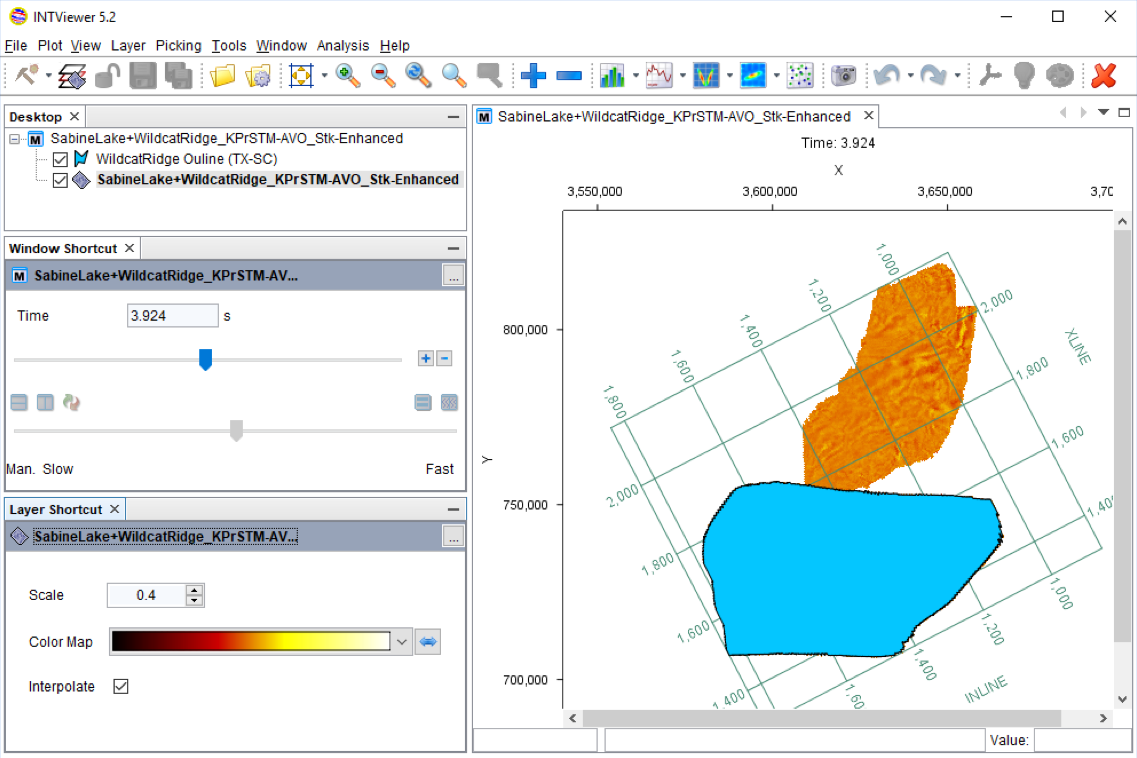
Open a seismic dataset as a time slice:
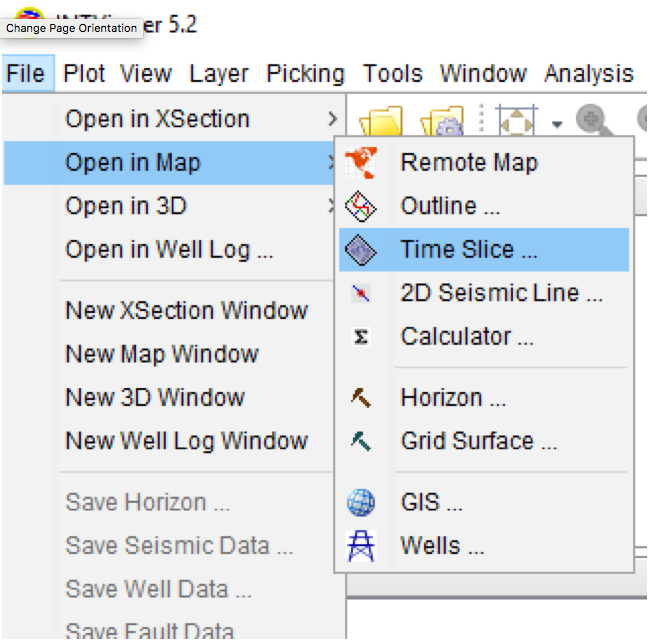
Then add a GIS layer:
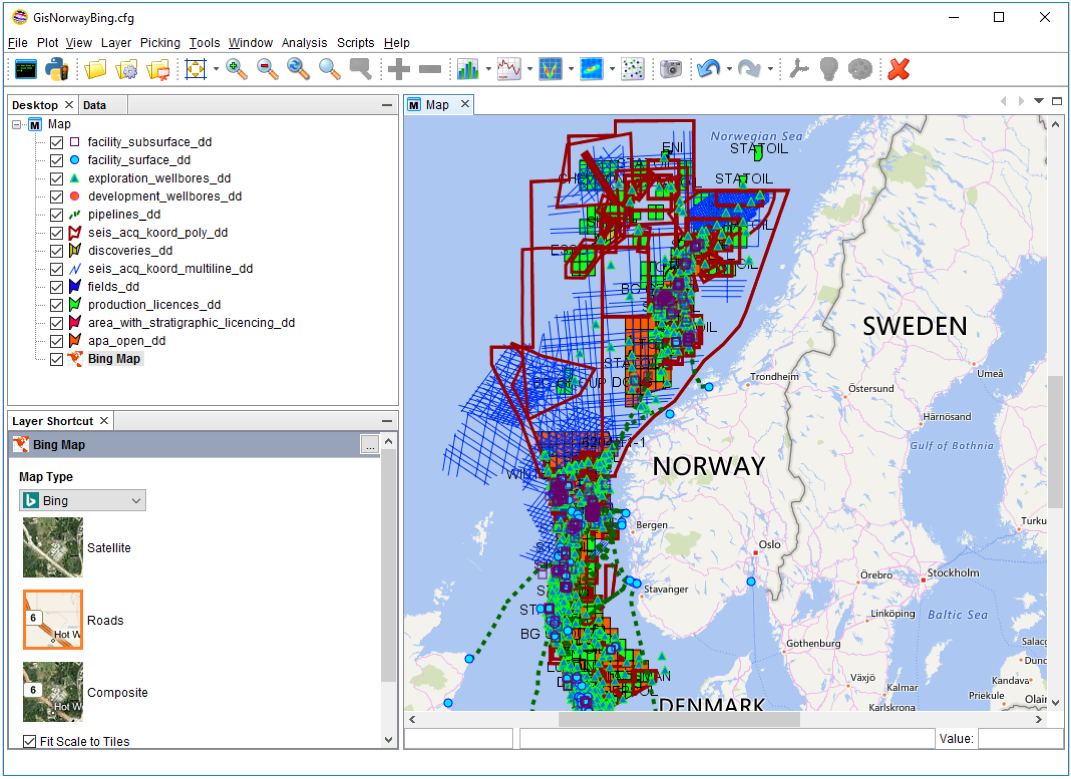
INTViewer’s support for shape files goes beyond visualizing simple polygons. The example below describes oil and gas fields West of Norway.
INTViewer also lets users create their own shape file programmatically (see our help site here). Check out the subject of our next post — one of the most interesting uses of shape files in INTViewer—the Mineral Rights plugin. In this plugin, seismic surveys are cut along regions delimited by shape files.
Stay tuned!
Check back soon for more new features and tips on how to use INTViewer or contact us for a demo.