Yesterday, I was invited to the Microsoft offices in Houston to install a demo of INTViewer. Microsoft advocates for solutions that are hosted on the cloud, and I found that INTViewer fits this model well.
The cloud is not just a set of computing resources hosting web based-applications. Microsoft Azure can also be used to host what we know today as desktop PCs. Constant availability and unlimited storage are just two of the numerous advantages of hosting your PC on the cloud.
To access our “PC in the cloud,” you only need a lightweight appliance hooked to a keyboard, a mouse and a monitor. An example of such appliance is the “Teradici Zero Client.” What’s different between a classic “Remote Desktop Solution” and Teradici’s solution is how rendering is implemented. Network latency can get in the way of the user experience if not done right. Teradici’s network protocol makes remote interaction seamless. This is important for INTViewer: At its core, INTViewer is a visualization application. Users typically have several large monitors to work with their data, which means a lot of pixels to transport.
A key to application performance is to keep your data and your visualization software close to each other. Once you put your geoscience data in Microsoft Azure, INTViewer allows instant visualization of that data. The reason why INTViewer is a good fit for that setup is that it’s a relatively lightweight application. Unlike large interpretation software, you typically only need 1 to 4 GB of memory to run. And it’s a snap to install.
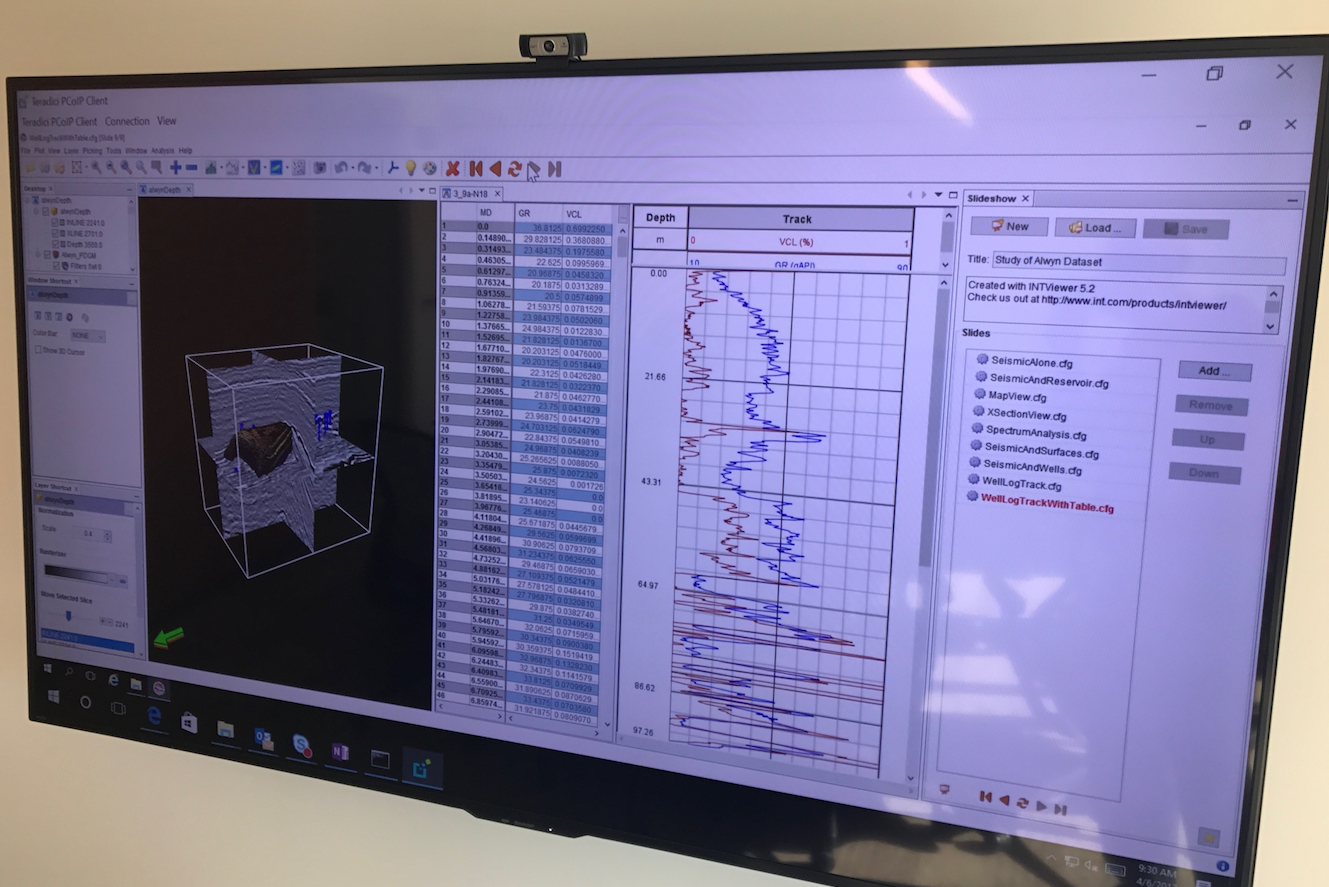
It’s quite a leap to decide to move terabytes of data to Microsoft Azure, and INTViewer is only one factor to that decision. However, there is one immediate use case for Microsoft Azure and INTViewer: INTViewer is a great tool for presentations. The slideshow plugin allows businesses to prepare presentations, each slide showing a particular aspect of a survey. I mocked up in a few minutes a presentation of the well-known Alwyn dataset. This presentation included visualization of a seismic survey and how it relates with wells and the reservoir model. For good measure, I added a spectrum analysis and a numerical view of log curves. The entire data underlying that presentation was only 10GB, easy to copy to Microsoft’s cloud at a moment’s notice.
This opens a new way to use INTViewer. Some of our customers use laptops to showcase acquisition data to potential clients. With a cloud-based solution, the burden of copying the data to each laptop disappears — you only need to copy it once to the cloud.
I was particularly proud of how well the slideshow plugin performed. Navigating through Alwyn became as simple as flipping through Powerpoint slides. But unlike a static presentation, attendees can interact with the data on demand. If a problematic data point is identified, it is easy to zoom, perform a live QA of that data, answer questions, and then move on to the next topic.
Check back soon for more new features and tips on how to use INTViewer or contact us for a demo of INTViewer in the cloud.