INTViewer is well-known for its seismic analysis capabilities. Among the less well-known plugins, there is a set that always impresses during demos: the microseismic plugins, a set of four plugins that allows INTViewer users to visualize microseismic events.
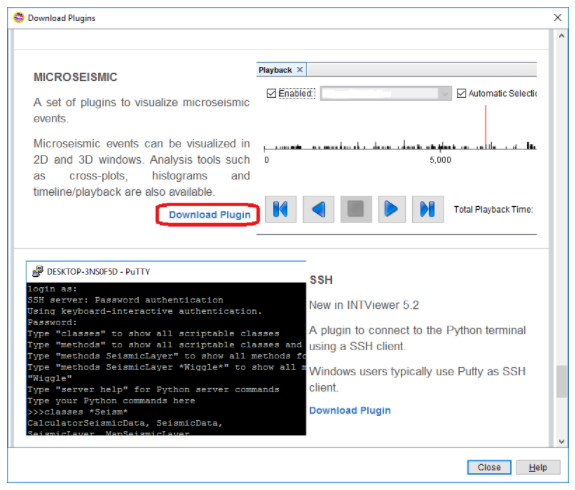
To download these free plugins from INTViewer, open Tools→Download Plugins and click the Download Plugin link. A wizard will open. Follow this wizard to perform the installation.
This installation adds a menu item to the File menu. Select File→Open in 3D→Microseismic, then select a dataset. INTViewer supports microseismic files in .CSV (comma-separated values) format. A microseismic dataset is essentially a set of X and Y points, and each point has a timestamp and attribute values. If your dataset is not stored in the .CSV format, it would be easy to plug your own with the INTViewer public API.
There are several ways that microseismic events can be represented in a .CSV file, and a mapping needs to be specified to let INTViewer know how to read this file. There is an Auto Detect button that facilitates that process.
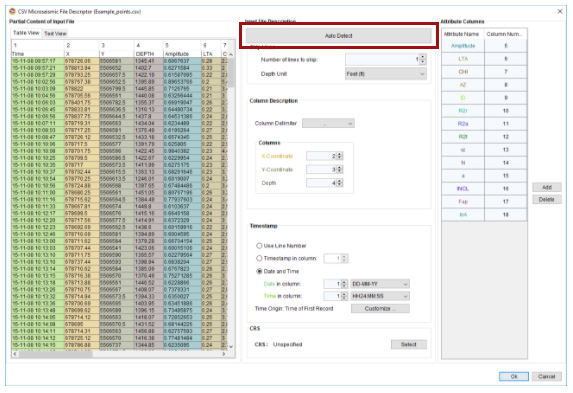
INTViewer is able to detect complex data formats, even with the date and time stored in the same column. In this example above, the timestamp section specifies that both date and time are stored in column 1.
The 3D visualization will load after you press the OK button.
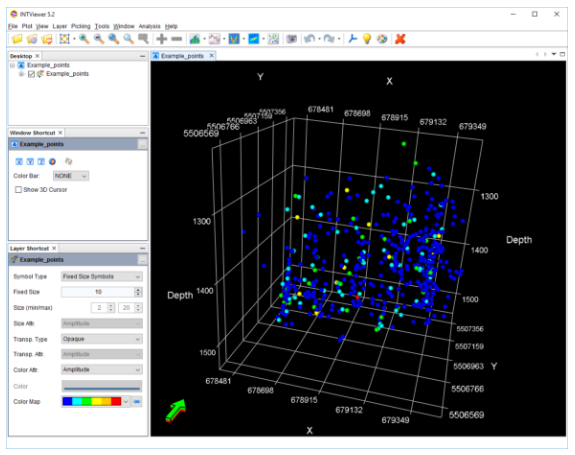
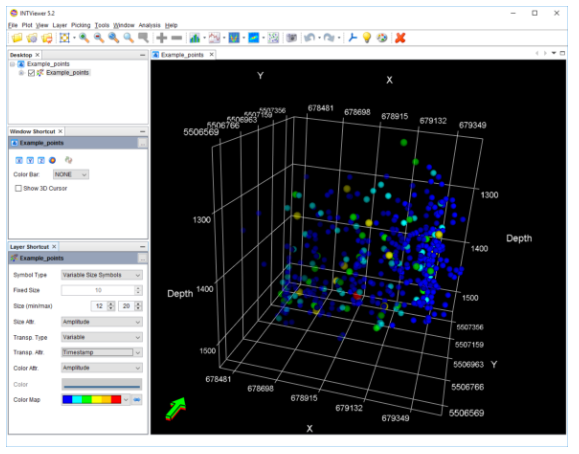
The visualization of microseismic events can have up to 7 dimensions. The first 3 dimensions are X, Y and Z. A 4th dimension is color. In the example above, points are colored by amplitude values. You can visualize a 5th dimension by selecting an attribute to control the size.
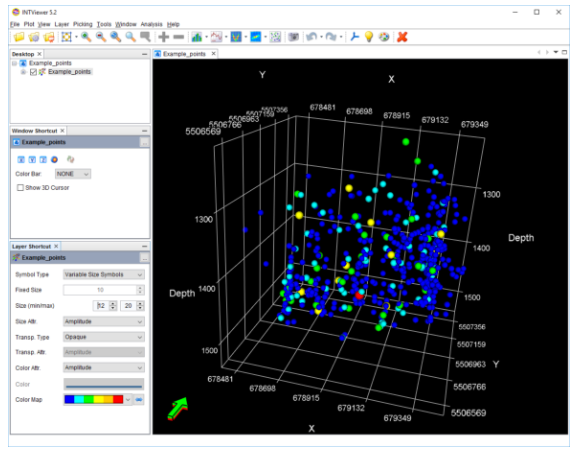
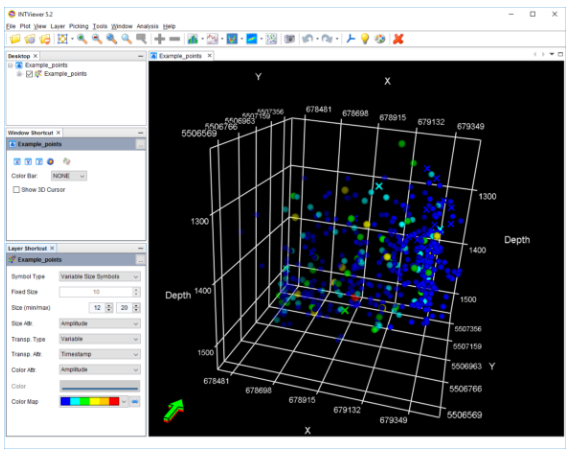
You can visualize a 6th dimension by selecting an attribute to control the transparency.
The last dimension are the symbols themselves. Just like we use color maps to color points, we can use symbol maps to symbolize points.
Because events are indexed by time, INTViewer makes it easy to reveal the sequence of events for a microseismic dataset. Open Window→Playback
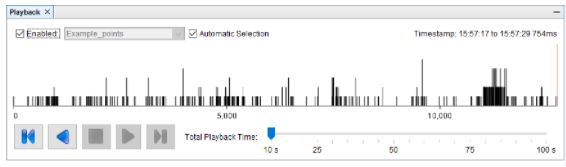
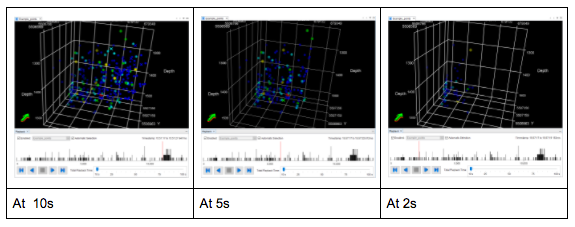
The Playback window shows an histogram of events, ordered by timestamp. The longer the bar, the higher the number of events for that timestamp. By pressing the Play buttons, you start the animation of all your microseismic displays.
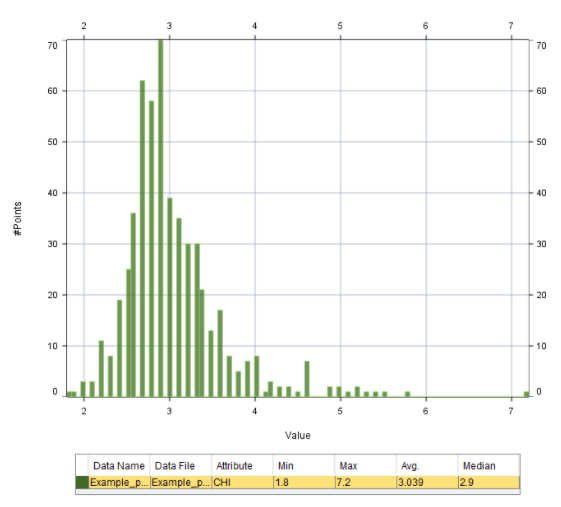
The playback window is not the only histogram you can visualize. The distribution of any attribute is accessible.
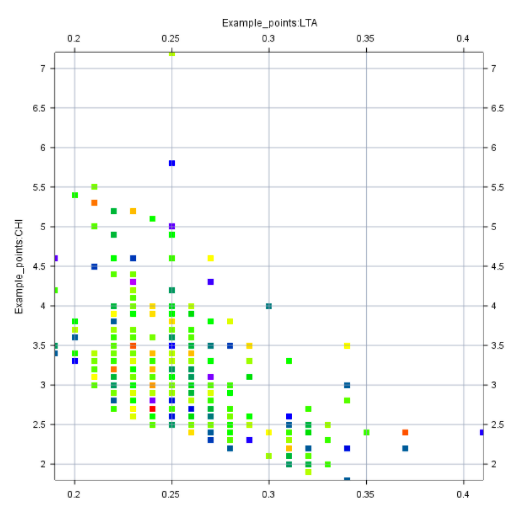
Cross-plotting is also possible. Select two attributes of a microseismic dataset for the X and Y axis, then one for the color.
The map window has capabilities similar to the 3D window. The color and symbol of points can be controlled by the values of any two attributes.
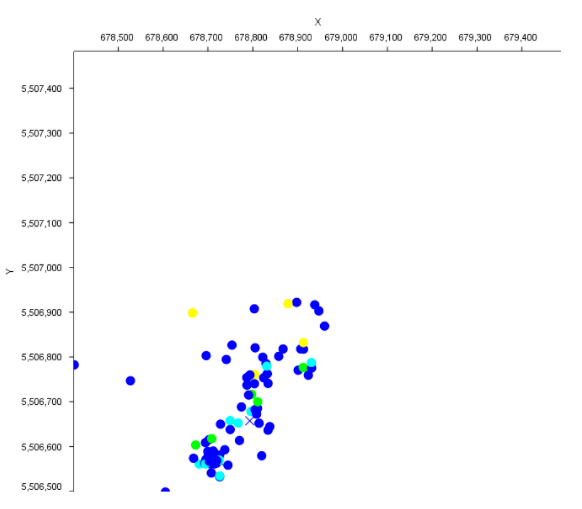
The map window is a powerful tool, featuring on-the-fly conversions between coordinate reference systems. If you specified a CRS during the mapping step, you can reproject your data to any other CRS.
All windows can visualize multiple datasets at once. In the example below, we combined a well and microseismic events.
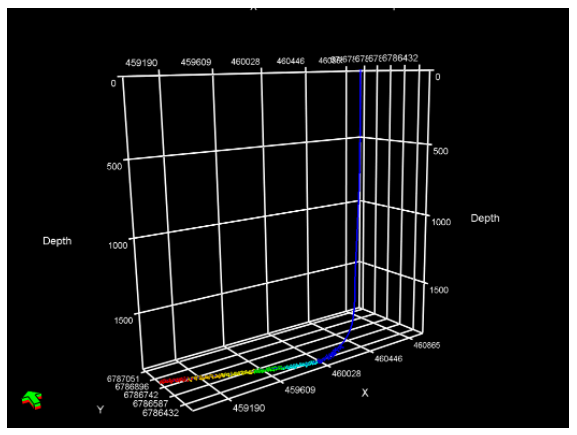
The XSection window visualization is particularly interesting. It allows you to combine a seismic dataset, a well trajectory, and microseismic events.
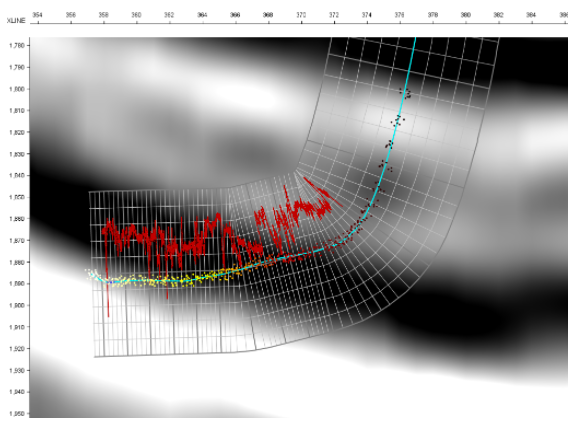
The Gamma-Ray (GR) well curve is shown in red
The last feature of this walkthrough is INTViewer’s Python scripting. Just like any other data type, you automate the visualization of microseismic events with a few lines of Python. INTViewer has the option to act as a Python server that an external system can easily control. Events can be added programmatically to microseismic datasets. New points are visualized immediately, making INTViewer an option to visualize real-time microseismic data.
We’ve published a few tutorials showcasing how Python can be used to work with microseismic data:
Generating synthetic microseismic data
Creating a sub-selection of a microseismic dataset using a cross-plot trend shape
Ready to learn more? Contact us for a live demo of the microseismic plugins!