• Skip to main content
  • Skip to footer

INT

Empowering Visualization

CONTACT US SUPPORT
MENUMENU
  • Products
    • Overview
    • IVAAP™
    • INTViewer™
    • GeoToolkit™
    • Product Overview
  • Demos
    • GeoToolkit Demos
    • IVAAP Demos
  • Success Stories
  • Solutions
    • Overview
    • For E&P
    • For OSDU Visualization
    • For Cloud Partners
    • For Machine Learning
    • For CCUS
    • For Geothermal Energy
    • For Wind Energy
    • For Enterprise
    • Tools for Developers
    • Services Overview
  • Resources
    • Blog
    • Developer Community
    • FAQ
    • INT Resources Library
  • About
    • Overview
    • News
    • Events
    • Careers
    • Meet Our Team
    • About INT

seismic data

Jun 02 2020

INT Brings OpenVDS Java Binding to the OSDU Community

Recently, INT announced our partnership with Bluware and our integration of Bluware’s OpenVDS format into IVAAP, our enterprise data visualization platform. We are very excited about this partnership, as well as our collaboration with OSDU. This new format was designed to empower users to browse seismic data in the cloud with high performance and lower cost.

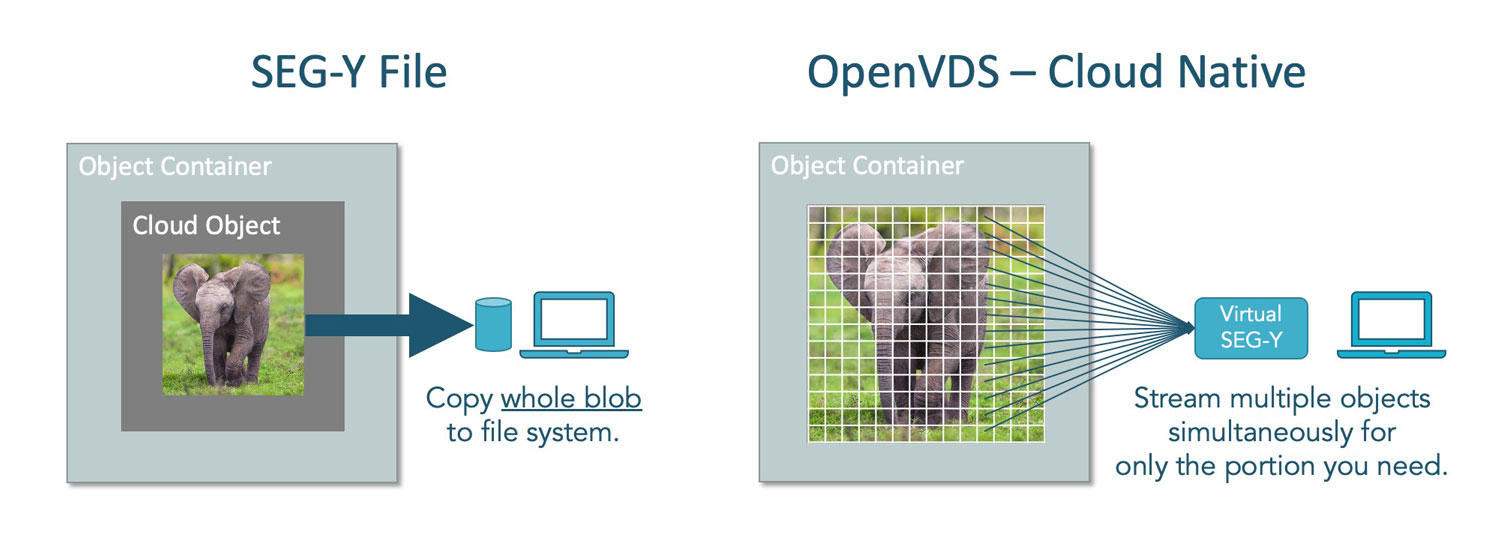
If you are not familiar with its capabilities: OpenVDS is a cloud-native way to store seismic data in the cloud. Unlike SEG-Y, which is linear, OpenVDS data is broken into small objects and stored in the cloud object store to provide very fast access to any part of the data. OpenVDS is serverless and supports any type of seismic data, including pre-stack.

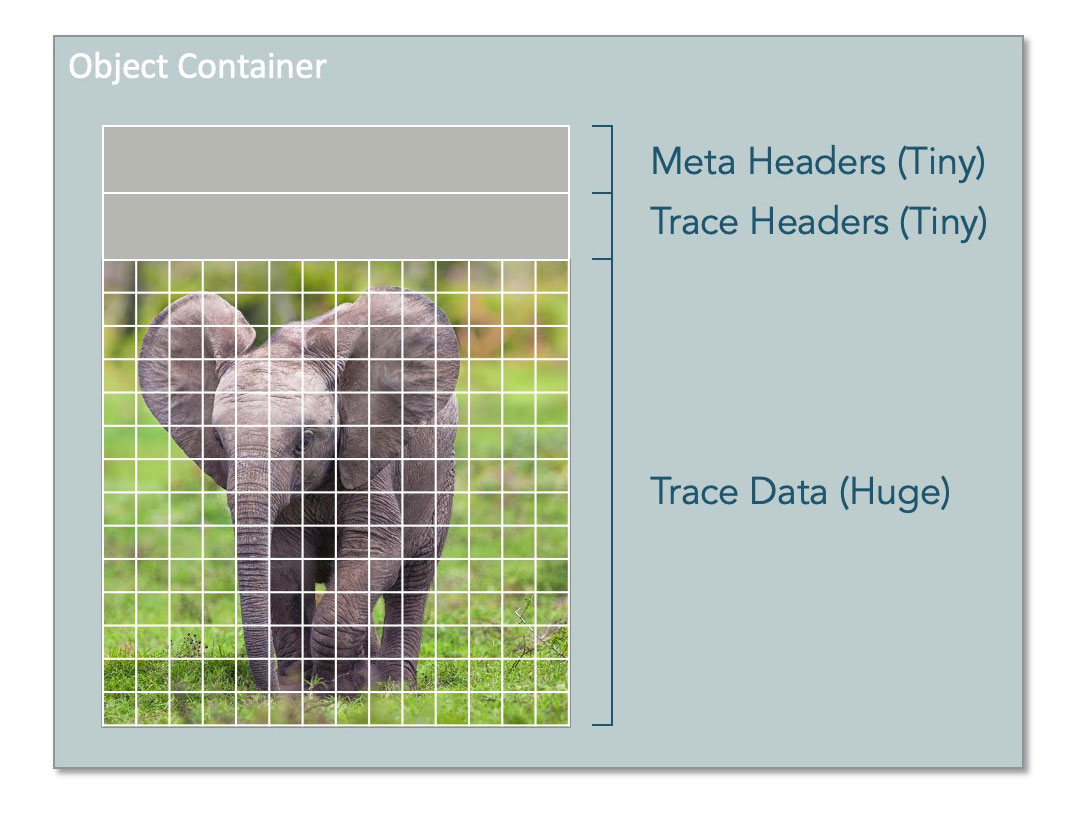
Here’s an example of how seismic data can be stored in the cloud:

seismic-data-cloud
Graphic courtesy of Bluware Corp.


But with OpenVDS, you have the option to store headers in the hot tier and trace data in the cold or cool tier (to restore as needed).

openvds-anatomy
Graphic courtesy of Bluware Corp.
 

Through our process of integrating this format, we realized that we could offer a bit more functionality to help more users adopt OpenVDS by offering also a JAVA binding option. Here’s a timeline of our process:

Late March 2020

After completing the VDS integration into IVAAP, we started work on OpenVDS compatibility.

Unfortunately, there was no Java binding for OpenVDS at the time. With Java being the most popular platform for complex web application backends, it seemed it would be profitable to all if the OpenVDS technology was easily usable in these environments.

Thus, we decided to bring our expertise to the community and started working on an open-source Java binding.

April 2020

Our expert team worked on the binding. After testing different approaches, we decided to avoid automatic binding technologies (Swig, …) and to write the JNI code manually.

This decision would allow us to ensure finer control over memory management, allowing us to reduce the cost of memory transfers between Java and native C++ worlds.

We also paid particular attention to the stability and error management since this library is to be used in server backends with huge uptimes.

May 18, 2020

We’re done! We are proud to announce that the work of our experts has been accepted and merged into the OpenVDS repository.

A special thank you to Bluware for their support and to Roman Matyaschuk, Ilia Mikhailichenko, and Camille Perin with INT for making this a success story.

For more information on IVAAP, please visit www.int.com/products/ivaap/


Filed Under: IVAAP Tagged With: Bluware, cloud, ivaap, openVDS, OSDU, seismic data

Sep 11 2018

Using INTViewer to Visualize Earthquakes and Other Seismic Activity

I often have a hard time explaining to friends and family what exactly INTViewer does. The moment I use the word “seismic,” the listener’s mind automatically shifts to the topics of seismic activity and earthquakes, and I need to explain oil & gas exploration technologies before I even get to the software. By then, I have lost my audience.

Today, I’ll try a different technique: I’ll describe the capabilities of INTViewer that actually cater to earthquake mapping. I will show how you can use the built-in capabilities of INTViewer to map recent earthquake activities.

To prepare for this blog article, I needed data. The United States Geological Survey (USGS) provides recent earthquake data on their website.

This data is provided in QuakeML format. INTViewer has a free plugin called Microseismic that opens QuakeML files directly. In this example, I downloaded the “All Earthquakes” QuakeML file for the past 30 days (all_month.quakeml), it opened right away, and after a few clicks, I got the visualization below:


World earthquake data last 30 days
World earthquakes from the last 30 days
Map is provided by Bing Maps
Data is provided by United States Geological Survey (USGS)


The color of each dot identifies the magnitude of each recorded event. I choose Bing Maps to show these events in context, requiring the installation of the free RemoteMap plugin.

There are a few websites proposing similar visualizations, but INTViewer can go further than these websites. For this example, I went to another data source, the International Seismological Centre (ISC) in the UK. This association compiles records of the earth seismicity, and provides a convenient way to search those records.

I decided to map earthquakes in Peru (longitudes from -83° to -65°, latitudes from -3° to -20°), starting from the 1970s to today. In the visualization below, the color and size of each dot identifies the depth of each recorded event.

Beachballs-coast
Peru earthquakes since 1970, showing depth variations
Map is provided by Bing Maps
Data retrieved from the ISC web site:
International Seismological Centre, On-line Bulletin


Seismologists typically use another type of visualization to identify the fault-plane solution, also known as focal mechanism. This mechanism describes the orientation of the fault plane that slipped as well as the slip vector. The colloquial name for this visualization is beachballs. Here are sample beachball representations provided by the Penn-State Geosciences Department:

focal-mechanisms
Focal mechanism examples


A single beachball describes three attributes of a seismic event: the strike, the dip, and the rake. These three attributes are present in the ISC exports and can be visualized in the form of beachballs in INTViewer. After changing the display options of my Peru session, I got the result below:

Beachballs-coast-2
Peru earthquakes since 1970, showing focal mechanisms
Data retrieved from the ISC web site:
International Seismological Centre, On-line Bulletin


Visualizing nature’s earthquakes is, of course, not a typical use of INTViewer, since most will use it as part of their seismic exploration QA workflow using data from manmade seismic events, but it is an interesting way to demonstrate how it works.

For more information about INTViewer, visit the INTViewer product page, or contact us for a free trial.


Filed Under: INTViewer Tagged With: beachball, earthquake data, INTViewer, seismic data

Footer

Solutions

  • For E&P
  • For OSDU Visualization
  • For Cloud Partners
  • For Machine Learning
  • For CCUS
  • For Geothermal Energy
  • For Wind Energy
  • For Enterprise
  • Tools for Developers
  • Customer Success Stories

Products

  • IVAAP
  • GeoToolkit
  • INTViewer
  • IVAAP Demos
  • GeoToolkit Demos

About

  • News
  • Events
  • Careers
  • Management Team

Resources

  • Blog
  • FAQ

Support

  • JIRA
  • Developer Community

Contact

INT logo
© 1989–2023 Interactive Network Technologies, Inc.
Privacy Policy
  • Careers
  • Contact Us
  • Search

COPYRIGHT © 2023 INTERACTIVE NETWORK TECHNOLOGIES, Inc