The inspiration for this blog comes from this poster that was recently added to our walls at the office.
So, how does INTViewer help developers empower users?
INTViewer provides many features off-the-shelf, but its extensibility is unique. Developers can customize numerous aspects of INTViewer by extending the INTViewer platform. And one way to extend this platform is to write Java plugins.
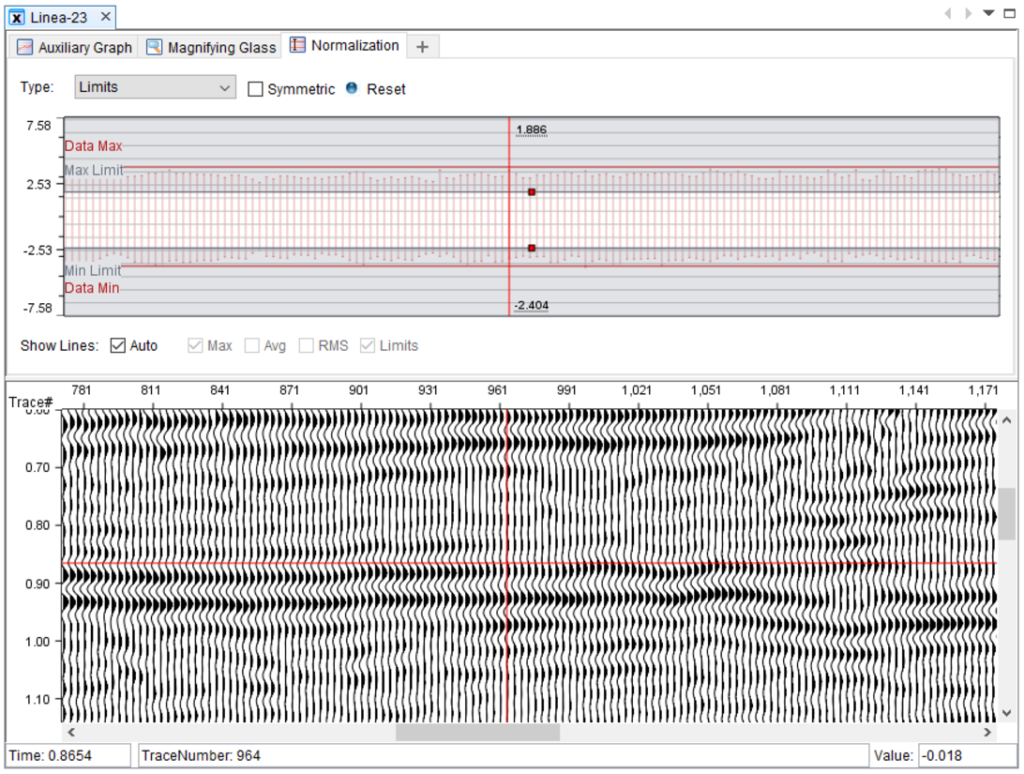
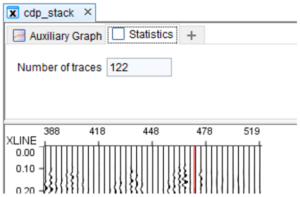
Here’s an example: INTViewer 5.2 has a new feature called Auxiliary Widgets which allows content to be displayed above XSection windows. I also mentioned this feature when I introduced the Normalization widget.

We maintain a dedicated site for developers to find tutorials and other reference material to learn how to write plugins. For example, here’s the step-by-step guide to help developers add their own auxiliary widget.

What’s remarkable about this example is that it only takes three small files to plug this fully functional feature. Meaning that not only is INTViewer an extensible platform, but it is also a platform that is simple to extend. We spent many hours on the public API to make sure it is easy to understand and easy to use, yet powerful.
Now, why is the ability to add content on top of XSection windows valuable? Hardware vendors are one example of a company that would want to leverage this feature. Companies who sell acquisition hardware need to provide a tool for their customers to visualize the proprietary data captured by their instruments. The auxiliary widgets area is an ideal place for showing additional data specific to acquisition hardware. As end users visualize a seismic dataset recently captured, they also visualize vital parameters of the acquisition session without having to open another dialog or window.
Extending INTViewer is a broad topic, impossible to cover in just one post, so check back often for more articles on this topic and more. Or to get started with plugins, check out this architecture article.
Check back soon for more new features and tips on how to use INTViewer or contact us for a demo.

