Current Plugins
Mineral Rights: Manage exclusion zones in seismic data to maintain compliance with license restrictions.
Navigation QC: Analyze and QC marine navigation data.
Slideshow: Allows an interactive browsing of seismic, session or Python files in the form of a slideshow.
SSH: Connect to a Python terminal using an SSH client.
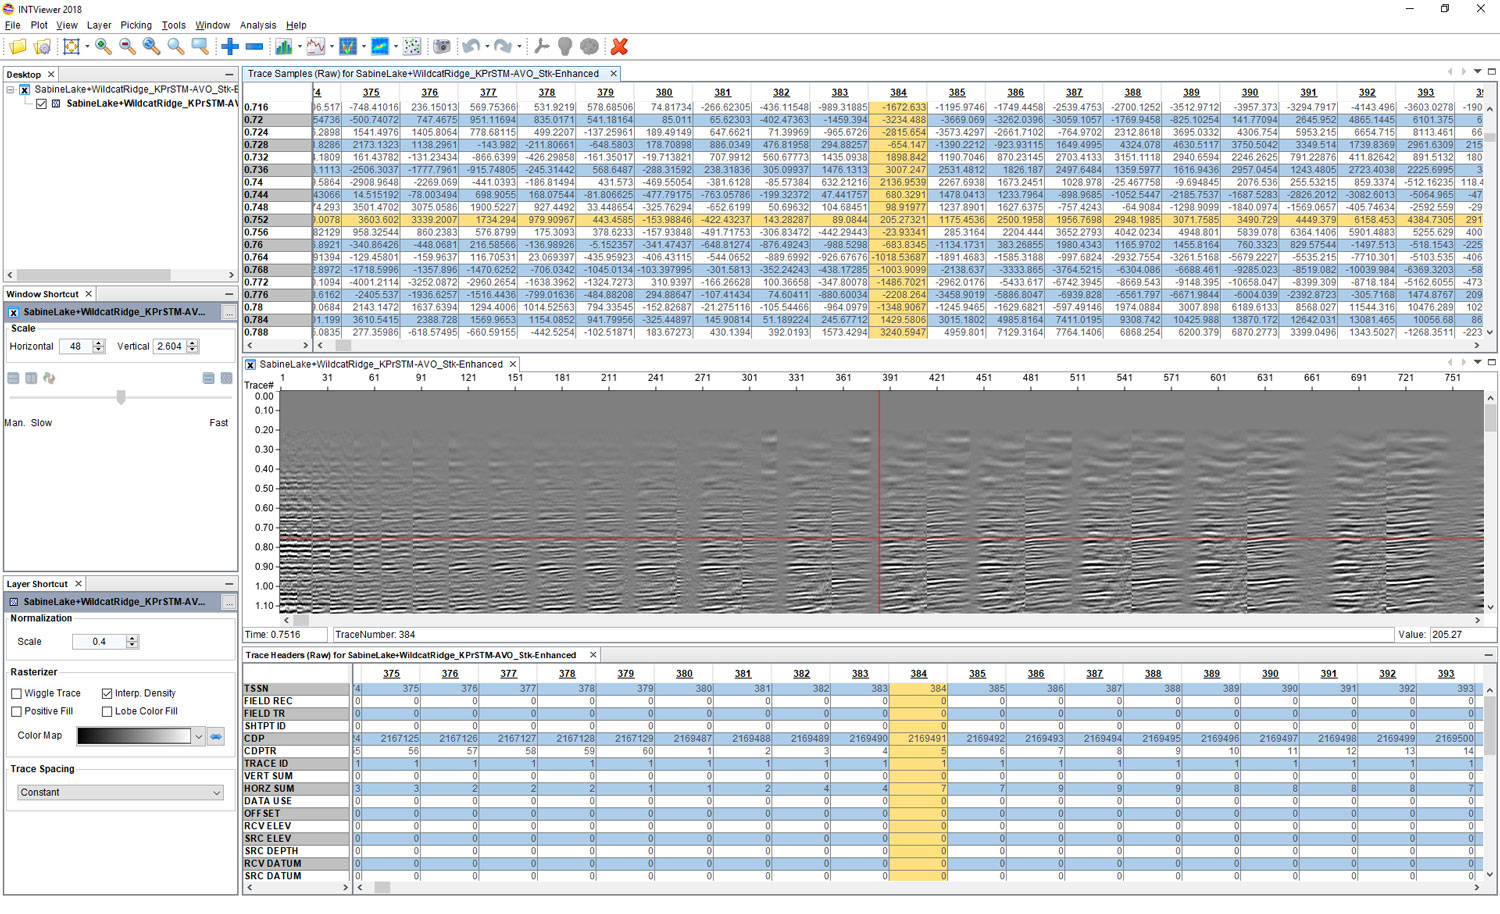
Comments: Annotate entire datasets, seismic slices, or specific traces to highlight specific features.
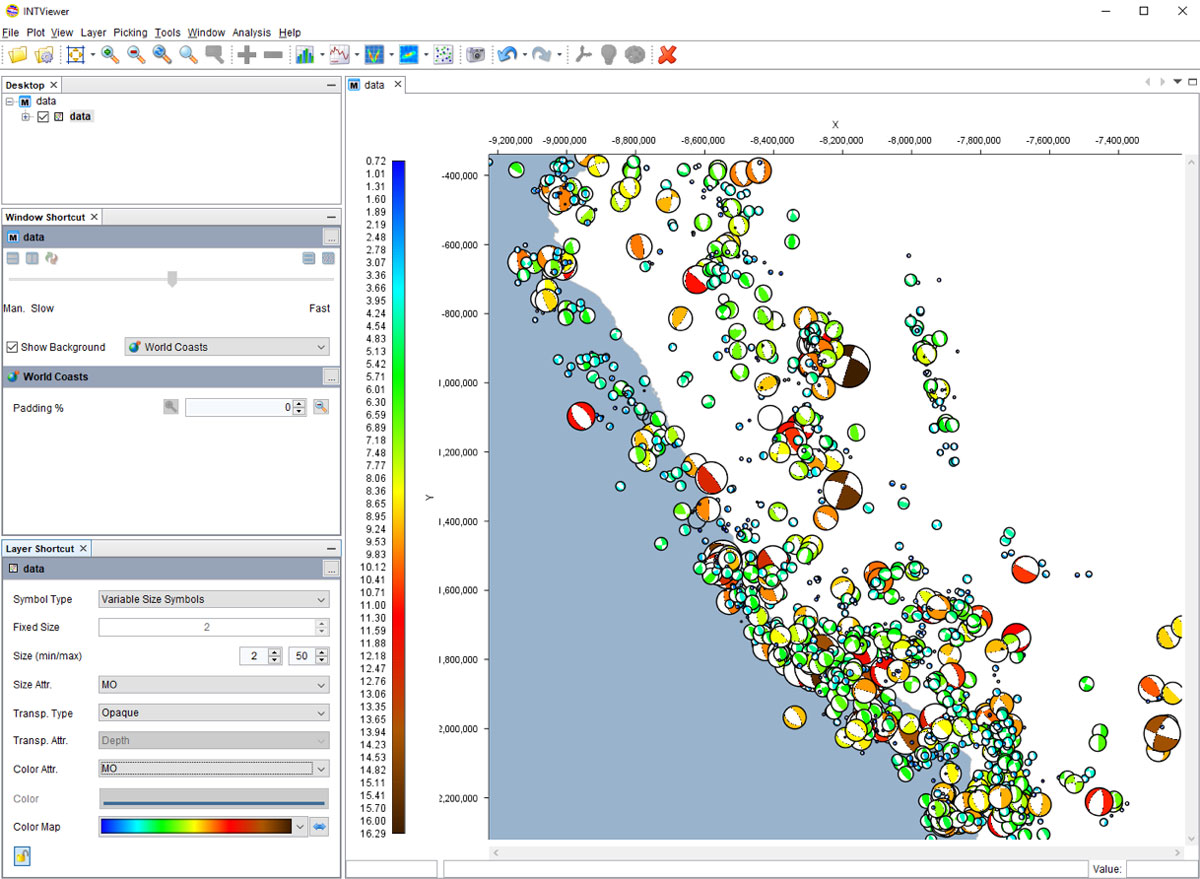
Microseismic: Visualize microseismic events in 2D and 3D windows. Analysis tools such as cross-plots, histograms and timeline/playback are also available.
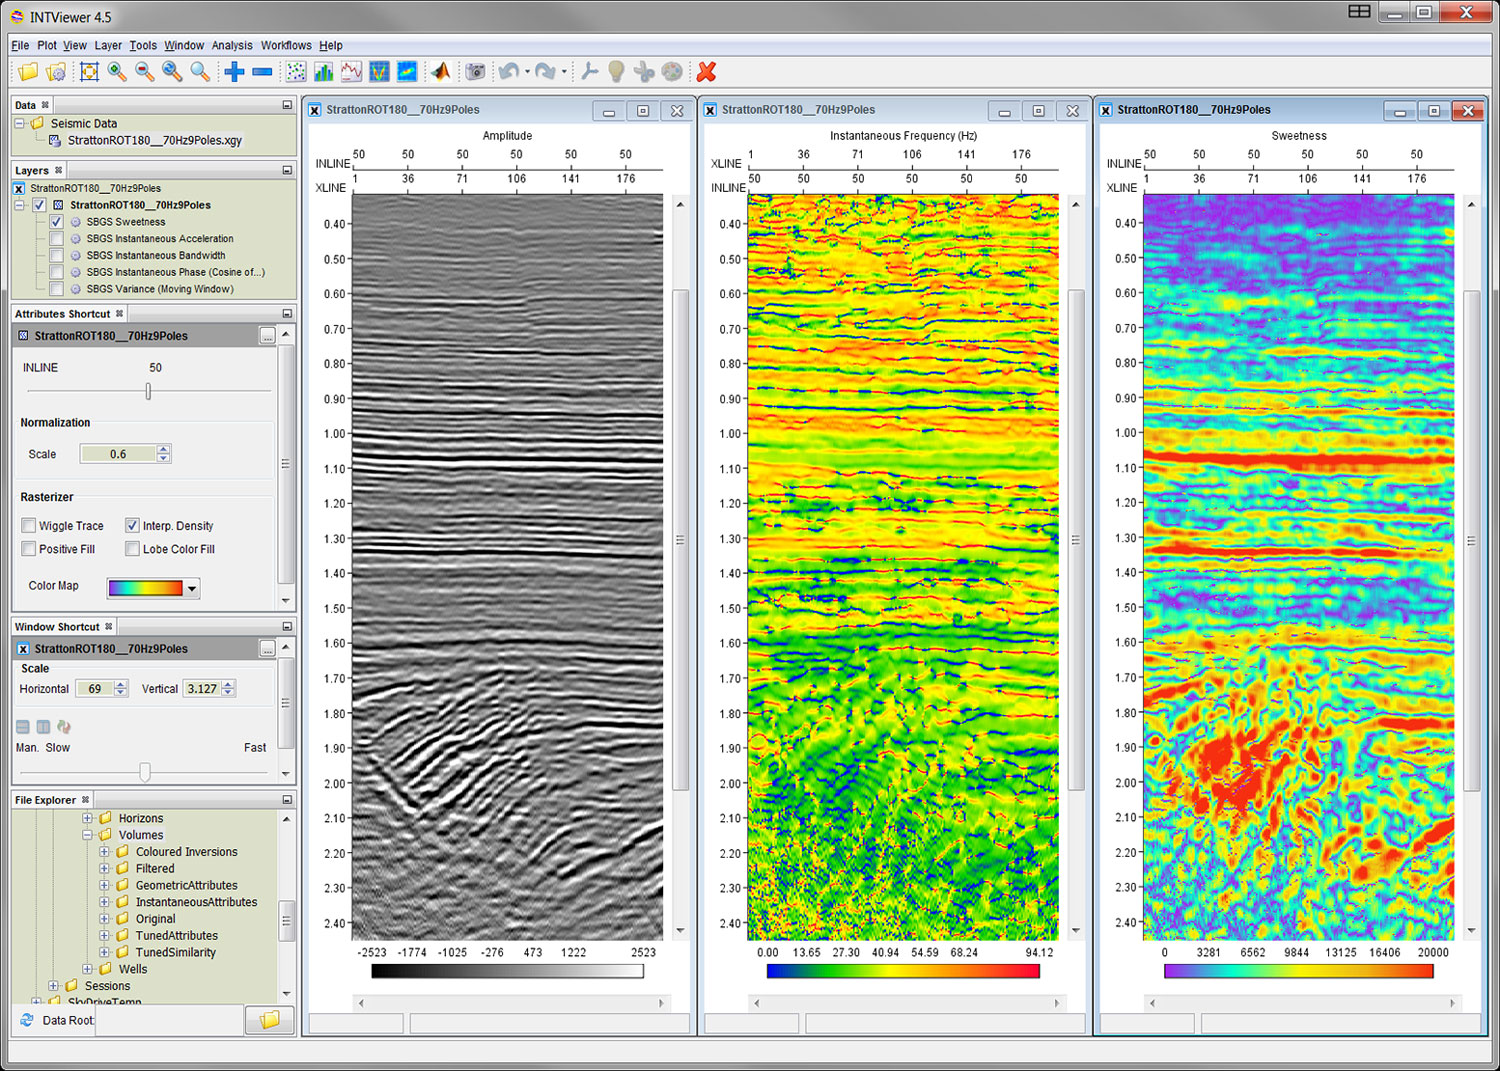
Saddleback Attributes::Workbench™: Provides a library of 24 single trace attributes using correct transforms, pre-conditioning of the trace.
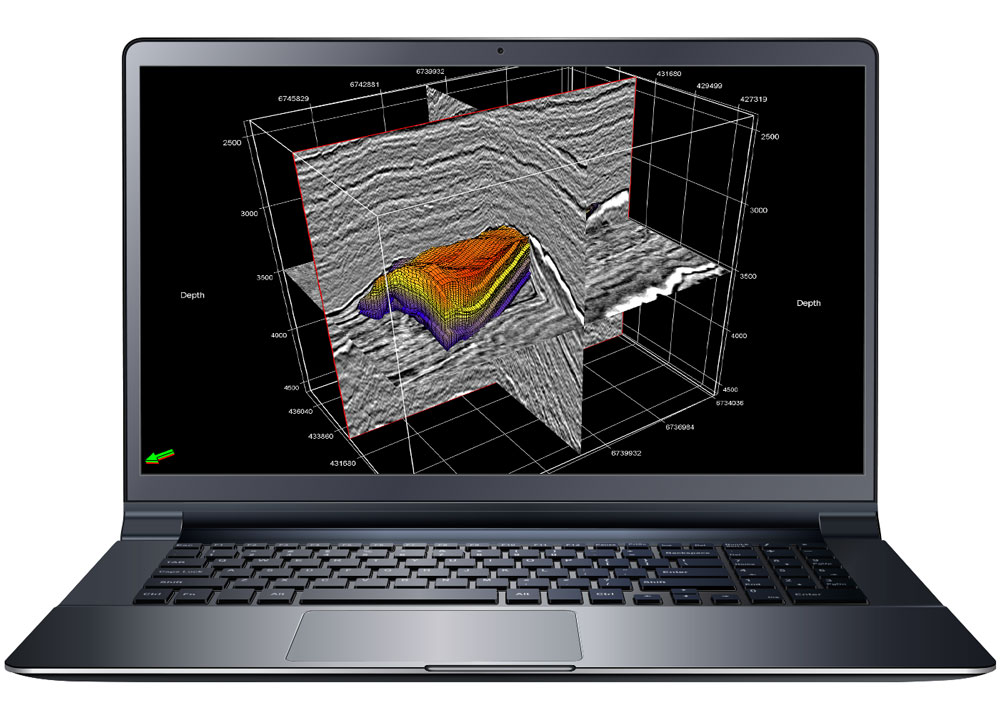
Horizon Attribute Extraction: Provides analysis, visualization, and statistics for properties along a single horizon, or in windows defined by or between horizons.
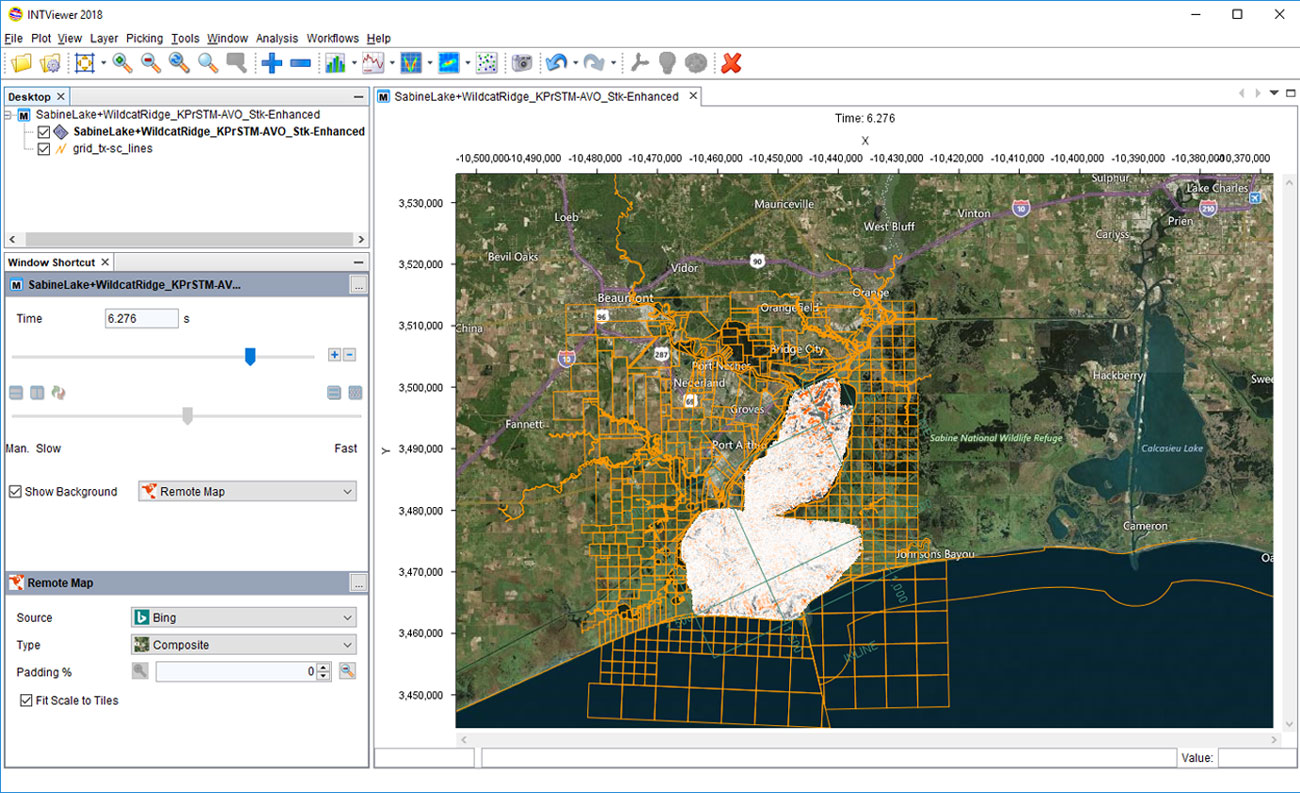
Remote Map: Connects INTViewer to a running Web Map Service (WMS) to stream georeferenced map images and associated road, boundary and culture data.
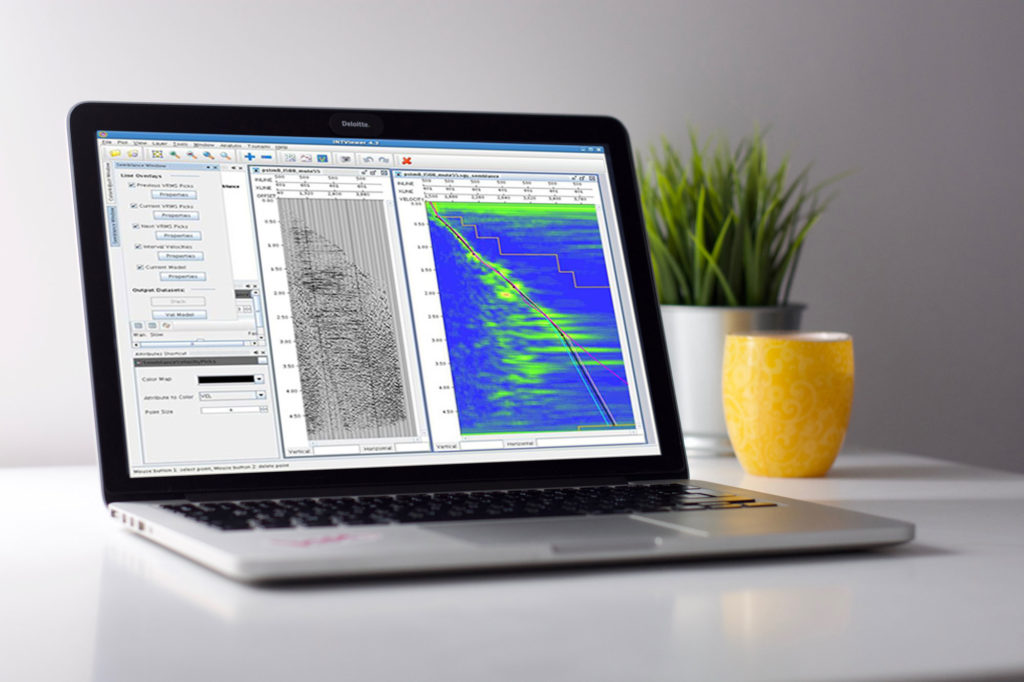
Velocity Measurement: Allows a user to dynamically compute and display velocities on a seismic section.
Seismic Workbench: Automates the processing of seismic datasets through the creation and execution of workflows utilizing external libraries (such as CWP/SU, FreeUSP, etc.).
AngleField: Calculates on-the-fly angle field based on seismic gather and velocity model.
Signal-to-Noise Analysis: Quantifies the signal-to-noise ratio within a user-selected window.The plugin provides the auto-correlation, cross-correlation and signal/noise, as well as some graph displays.
ZGY Data: Provides reading capabilities for the Schlumberger® ZGY/Petrel® seismic format.
Python Filter: Allows a quick prototyping of processing algorithms using the Python language.
Space Mouse Adapter: Improves the navigation within 3D windows by leveraging the 3DConnection mouse.
Lattice Decimation: Decimates a 3D SEGY seismic volume by specifying a step value in each dimension.
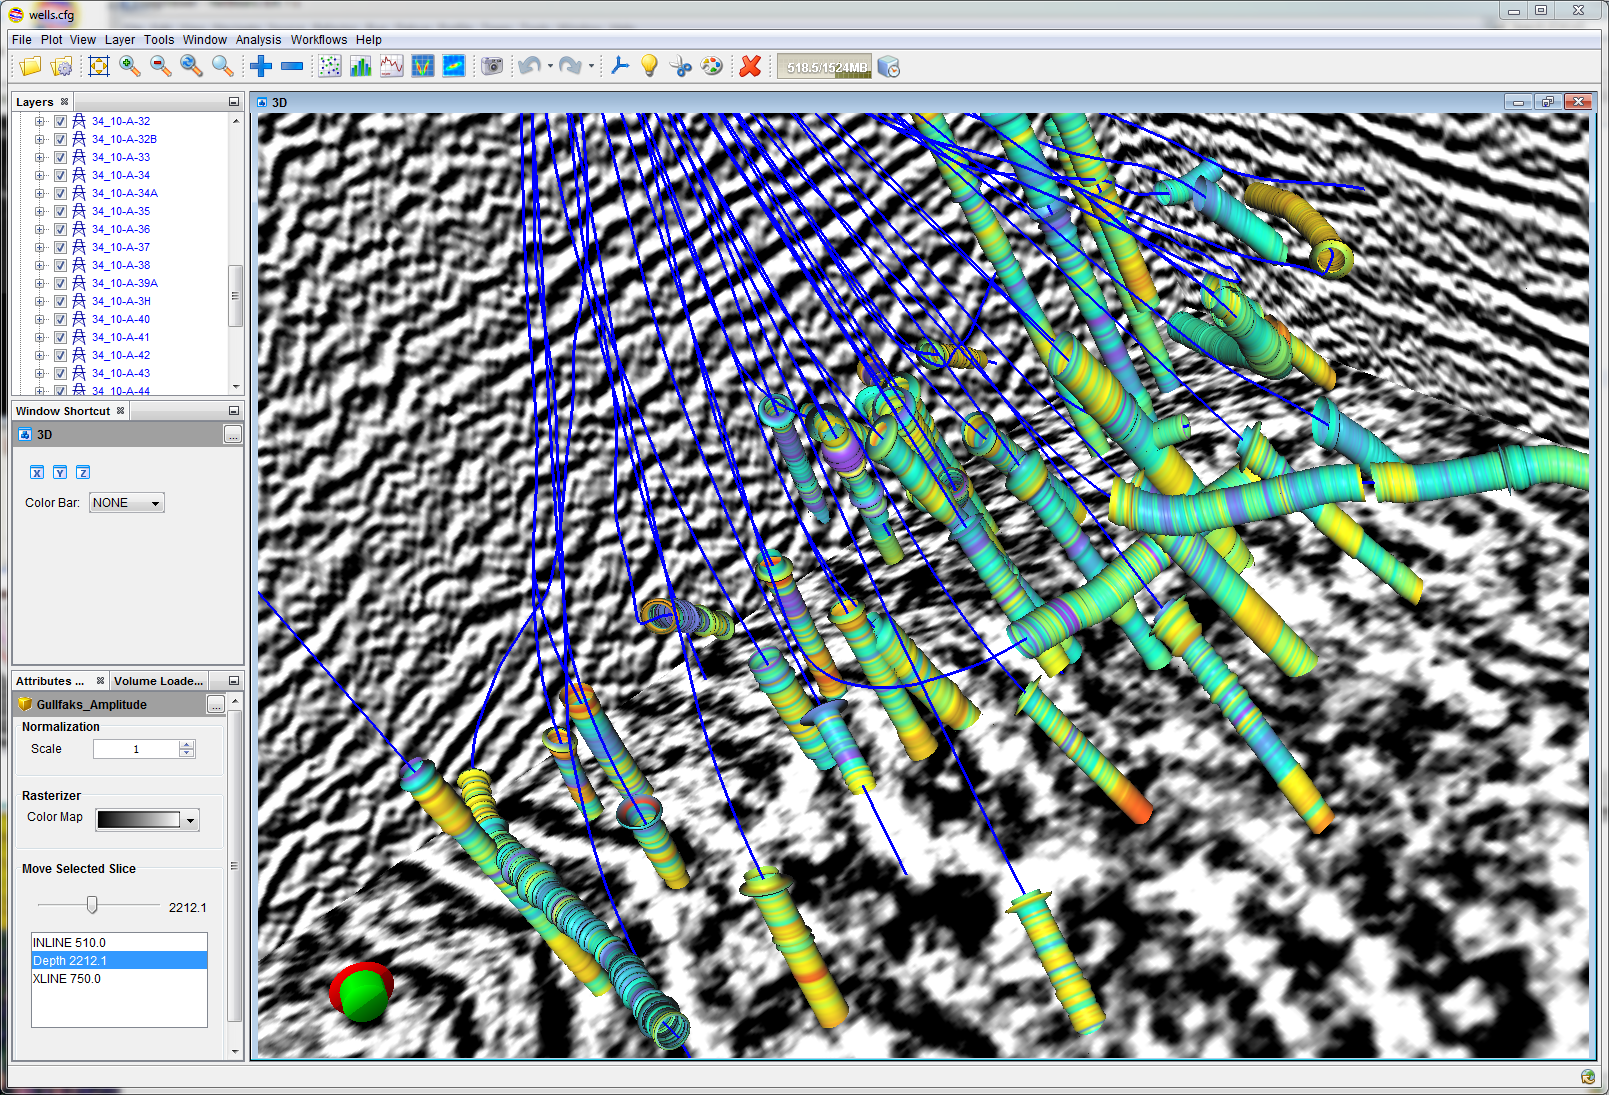
Reservoir: Visualize reservoir data in 3D windows. AND MANY MORE …