If you are already a user of INTViewer, the first thing you will certainly notice when you open INTViewer 5.2 for the first time is the new window system. The way windows are laid out on screen has changed, introducing tabs to browse through these windows.
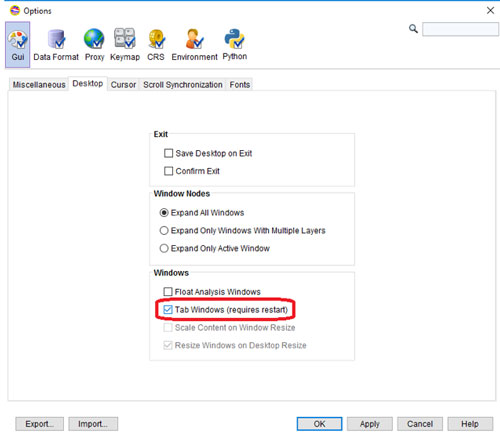
Before panic sets in, I want to reassure you: The window system you used in previous versions has not been removed. You can actually revert back to it.
Now the question becomes: “Which window system works best for my workflow?” As INTViewer is used in many different ways for many different outcomes, it’s difficult to give a definitive answer. Let’s explore what each window system is best for.
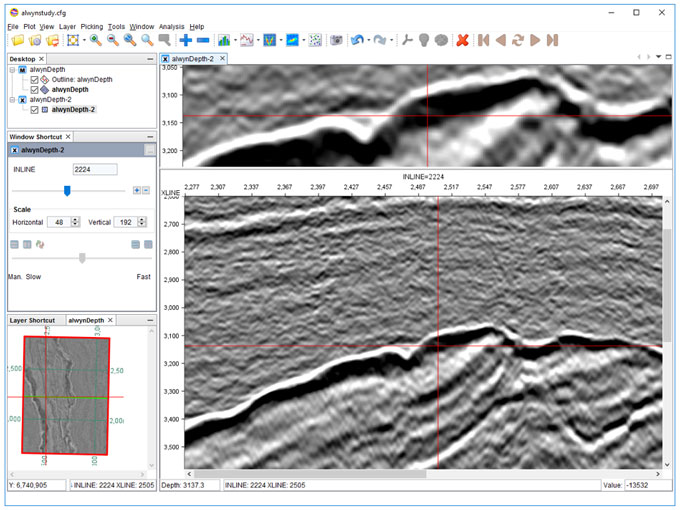
The new “TABS” window system is versatile. You can place your data windows anywhere on the INTViewer desktop, not just the middle area. In the example below, the time slice of the survey is displayed on the side. The XSection window is front and center. As you move your cursor in the XSection window, cursor synchronization allows you to locate which slice of the survey you are looking at, but the time slice doesn’t take precious screen space.
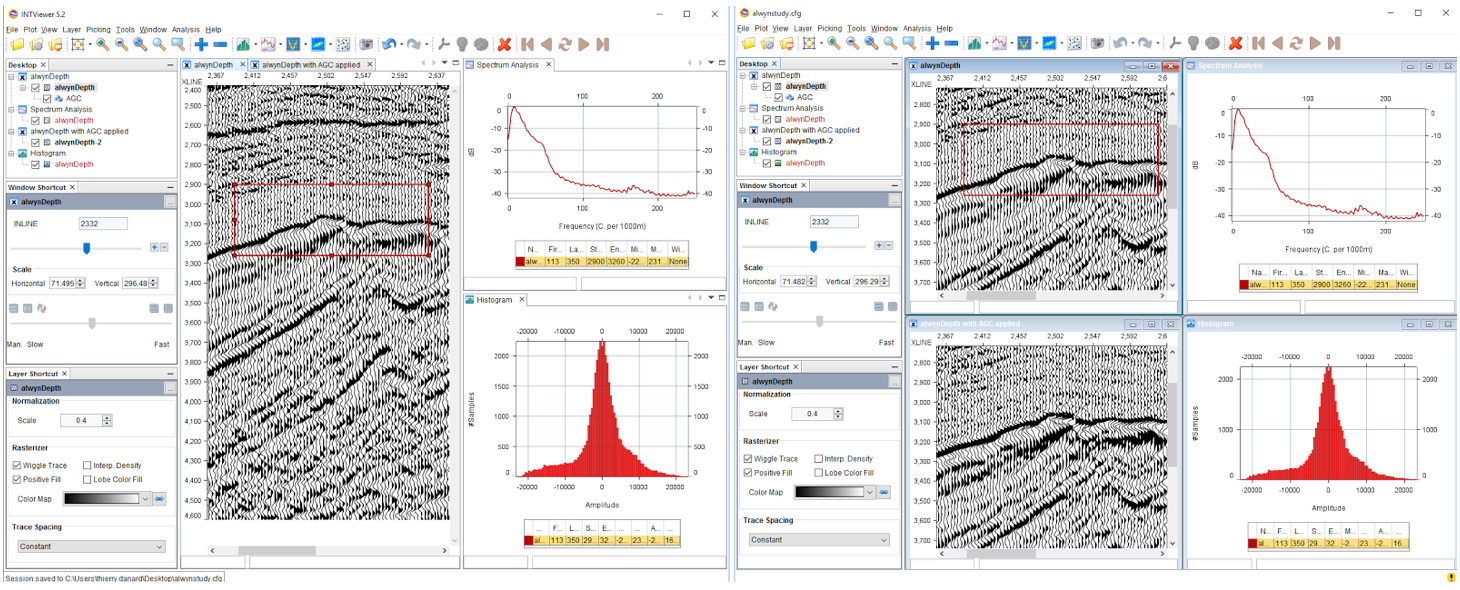
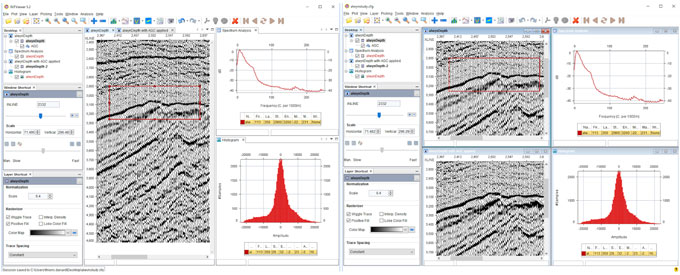
As the user base of INTViewer grew, I noticed it was being used to show an increasing number of windows at the same time. Managing all these windows can become a task in itself. The example below shows how we’ve upgraded INTViewer so you can keep dozens of windows while focusing on a few select visualizations.
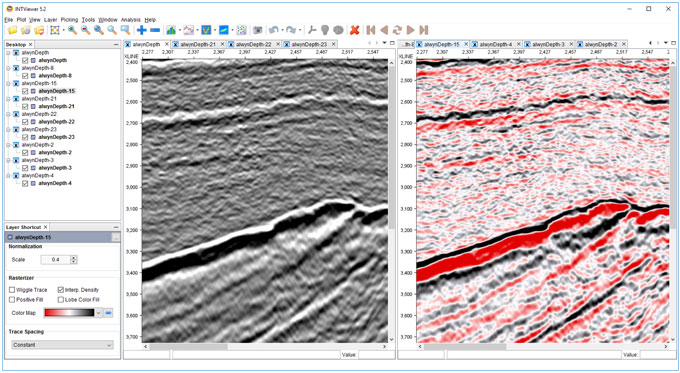
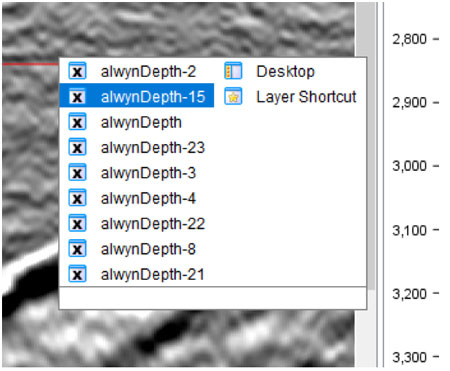
This layout is especially useful if you use INTViewer to QA the result of processing steps. Tabs allow you to keep your content manageable: Each window is quickly accessible, but they don’t overlap. There is even a shortcut to switch between windows. Press Ctrl+Tab at the same time, and the following switch panel will show:
Another advantage of the “TABS” window system is that sessions remember the state of each window, not just data windows. When you open a session, the full layout of your INTViewer session is remembered.
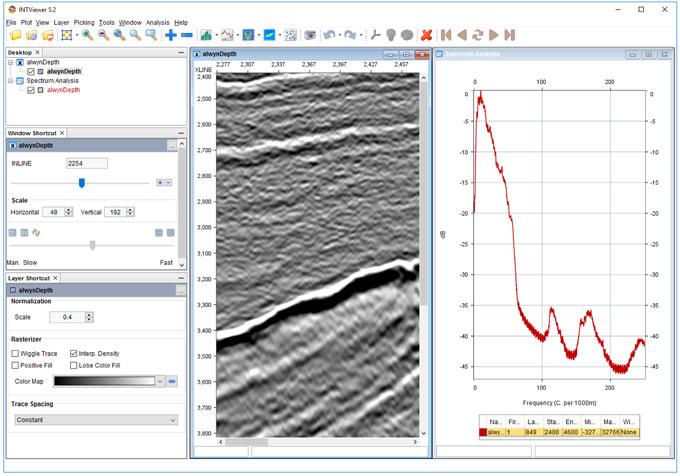
With this quick introduction to the “TABS” window system, why would anybody want to revert to the legacy one? In my experience, the “Frames” window system works great on laptops, where screen size comes at a premium and you only need to perform one simple task. INTViewer is a great tool for acquisition QC in the field. It takes seconds to open a dataset and perform a spectrum analysis, making it a good fit when you need the mobility of laptops.
INTViewer is also a development platform. Customers develop their own plugin to make INTViewer perform one specific task. For example, if you develop a velocity picking plugin, the layout of your screen will be quite standard: one window shows the original data, another shows the velocity model, and the last one shows the modified data based upon this velocity model. Users spend long hours working only with these three windows, and the user experience needs to be optimized for this work.
The API in the “FRAMES” window system allows programmers to finely control the placement and size of each window. I visited a customer last week that did exactly that for this one plugin. Users of that plugin had a standard workstation with three monitors, and the plugin would make sure that each window would be shown in its own monitor.
Personally, since I work on a desktop PC with two large monitors, I prefer the “TABS” window system. The “TABS” window system has been an option in INTViewer for a few years. It has matured nicely, and after integrating feedback from early adopters, I believe this is now ready for prime time as the default option.
Check back soon for more new features and tips on how to use INTViewer or contact us for a demo.