The release also includes many new tutorials and demos for ES6, new features around WebGL, WebAssembly, and more.
Houston, TX —INT is pleased to announce the newest release of GeoToolkit.JS data visualization libraries and toolkit. This major release includes new 3D visualization capabilities—contour 3D, 3D shape highlighting, and better 3D seismic—and new rendering options.
“Visualizing seismic data in the cloud is a challenge for many oil and gas companies. We have been working closely with our developers and partners to find ways to optimize seismic visualization and workflows for our users,” said Dr. Dmitriy Lukyanenko, Director of Software Development at INT. “We’ve added server-side rendering and improved our decompression and compression techniques to speed up performance and have optimized our seismic reader. We think these improvements will result in significant performance gains for our clients.”
GeoToolkit.JS 2020.1 also includes improved capabilities such as combined Vertical and Deviated Schematics, more robust BHA editor, new heatmap layer, and seismic decompression and filters with WebAssembly.
RELEASE HIGHLIGHTS:
- Server-Side Rendering Capabilities — To offer a complete set of options for great performance for interacting with seismic in the cloud, we added support for server-side rendering in addition to the existing widget for client-side rendering by just integrating new services
- Improved ES6 Support — Full set of all-new tutorials and demos for ES6 with code snippets. Supports Angular, React, and Vue frameworks.
- Redesigned the Graphical Annotation — A new version of annotation tool with layer support to add text and graphical annotations, plus a demo to demonstrate this functionality to facilitate adoption
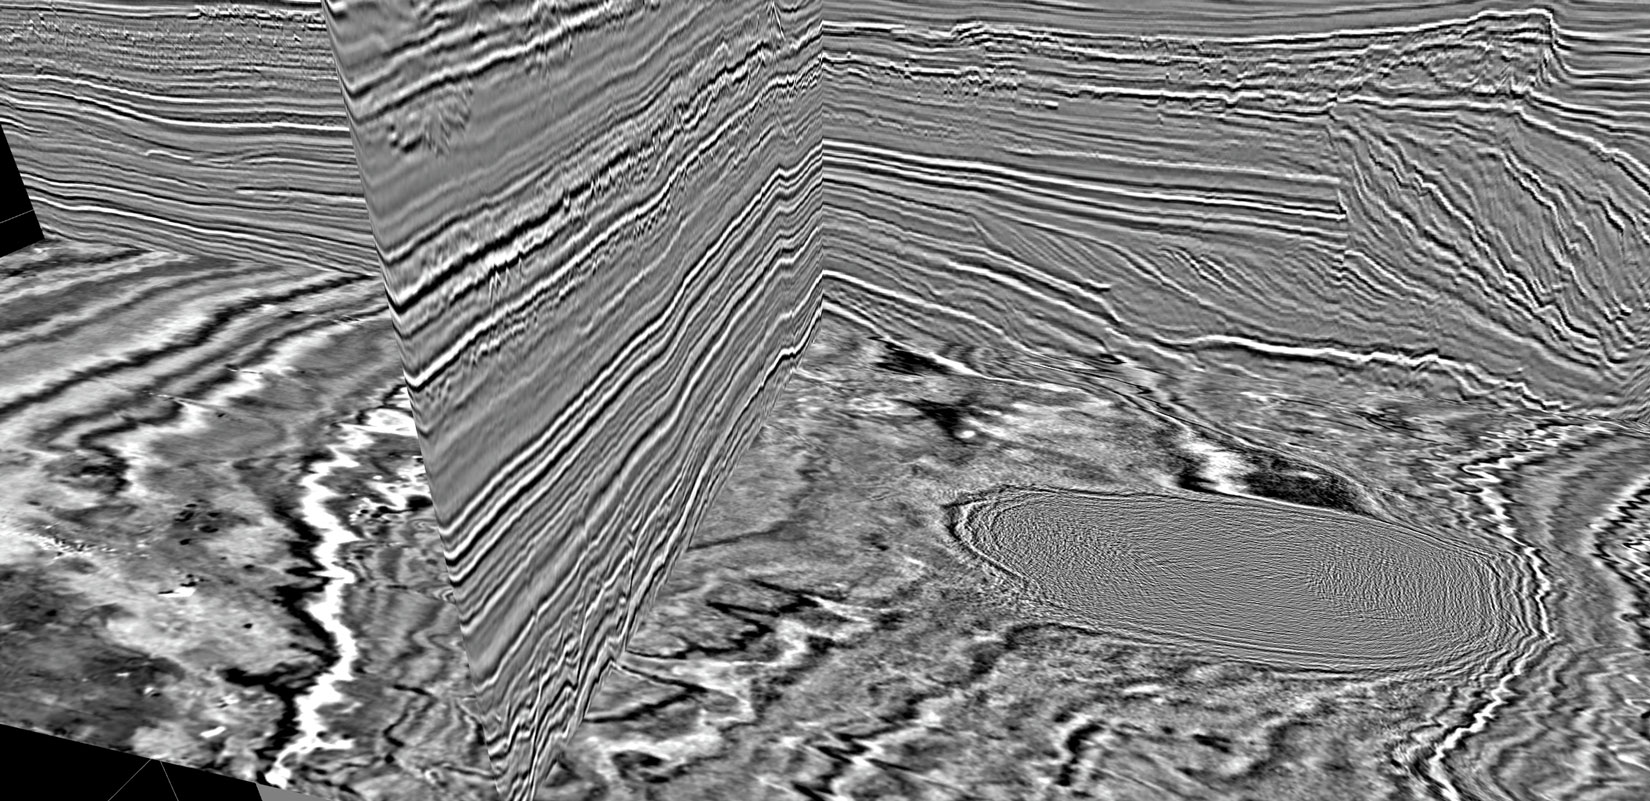
- New 3D Features and Faster 3D Rendering — New contour 3D (in addition to existing 2D), optimized 3D seismic visualization (same API but faster rendering), and new 3D shape highlighting, and multilateral trajectory
- MultiWell Performance Enhancements — Improved performance of MultiWellWidget if the same template is used for all wells
- WebGL — Optimized deviated image and gradients and array log (log2d) with WebGL.
Read the press release on PRWeb >
For more information about GeoToolkit.JS or INT’s other data visualization products, please visit www.int.com.