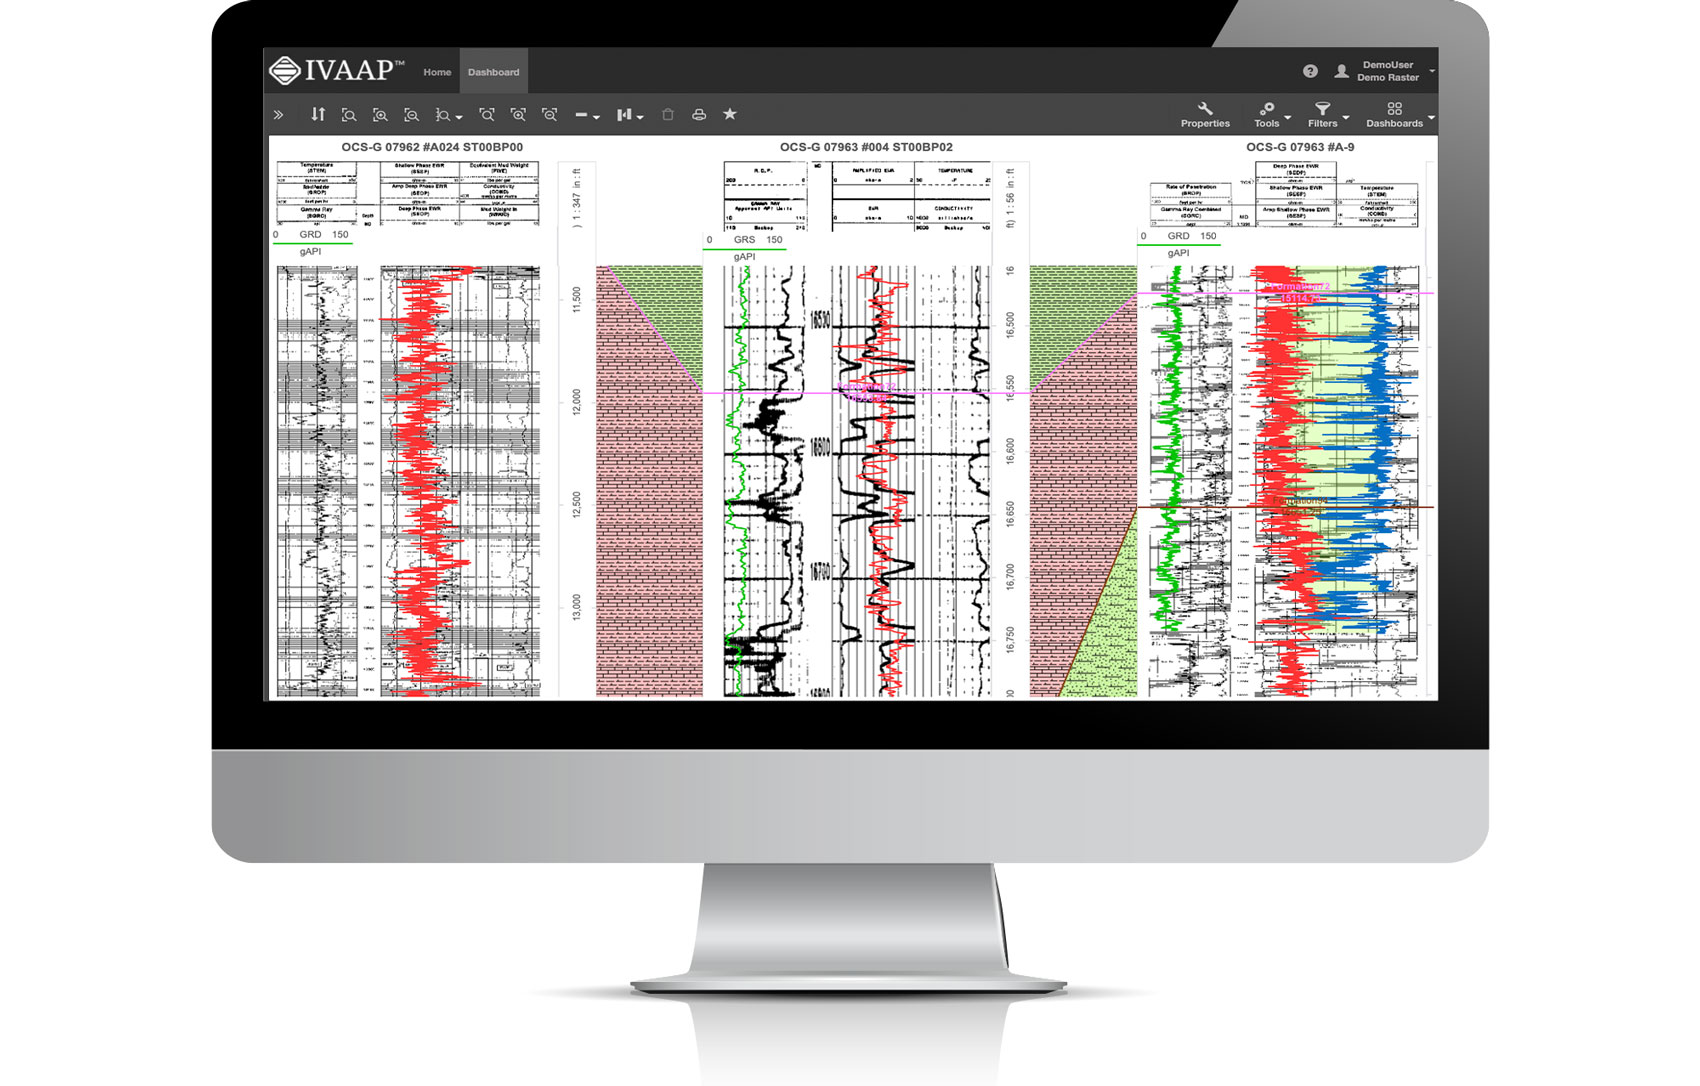
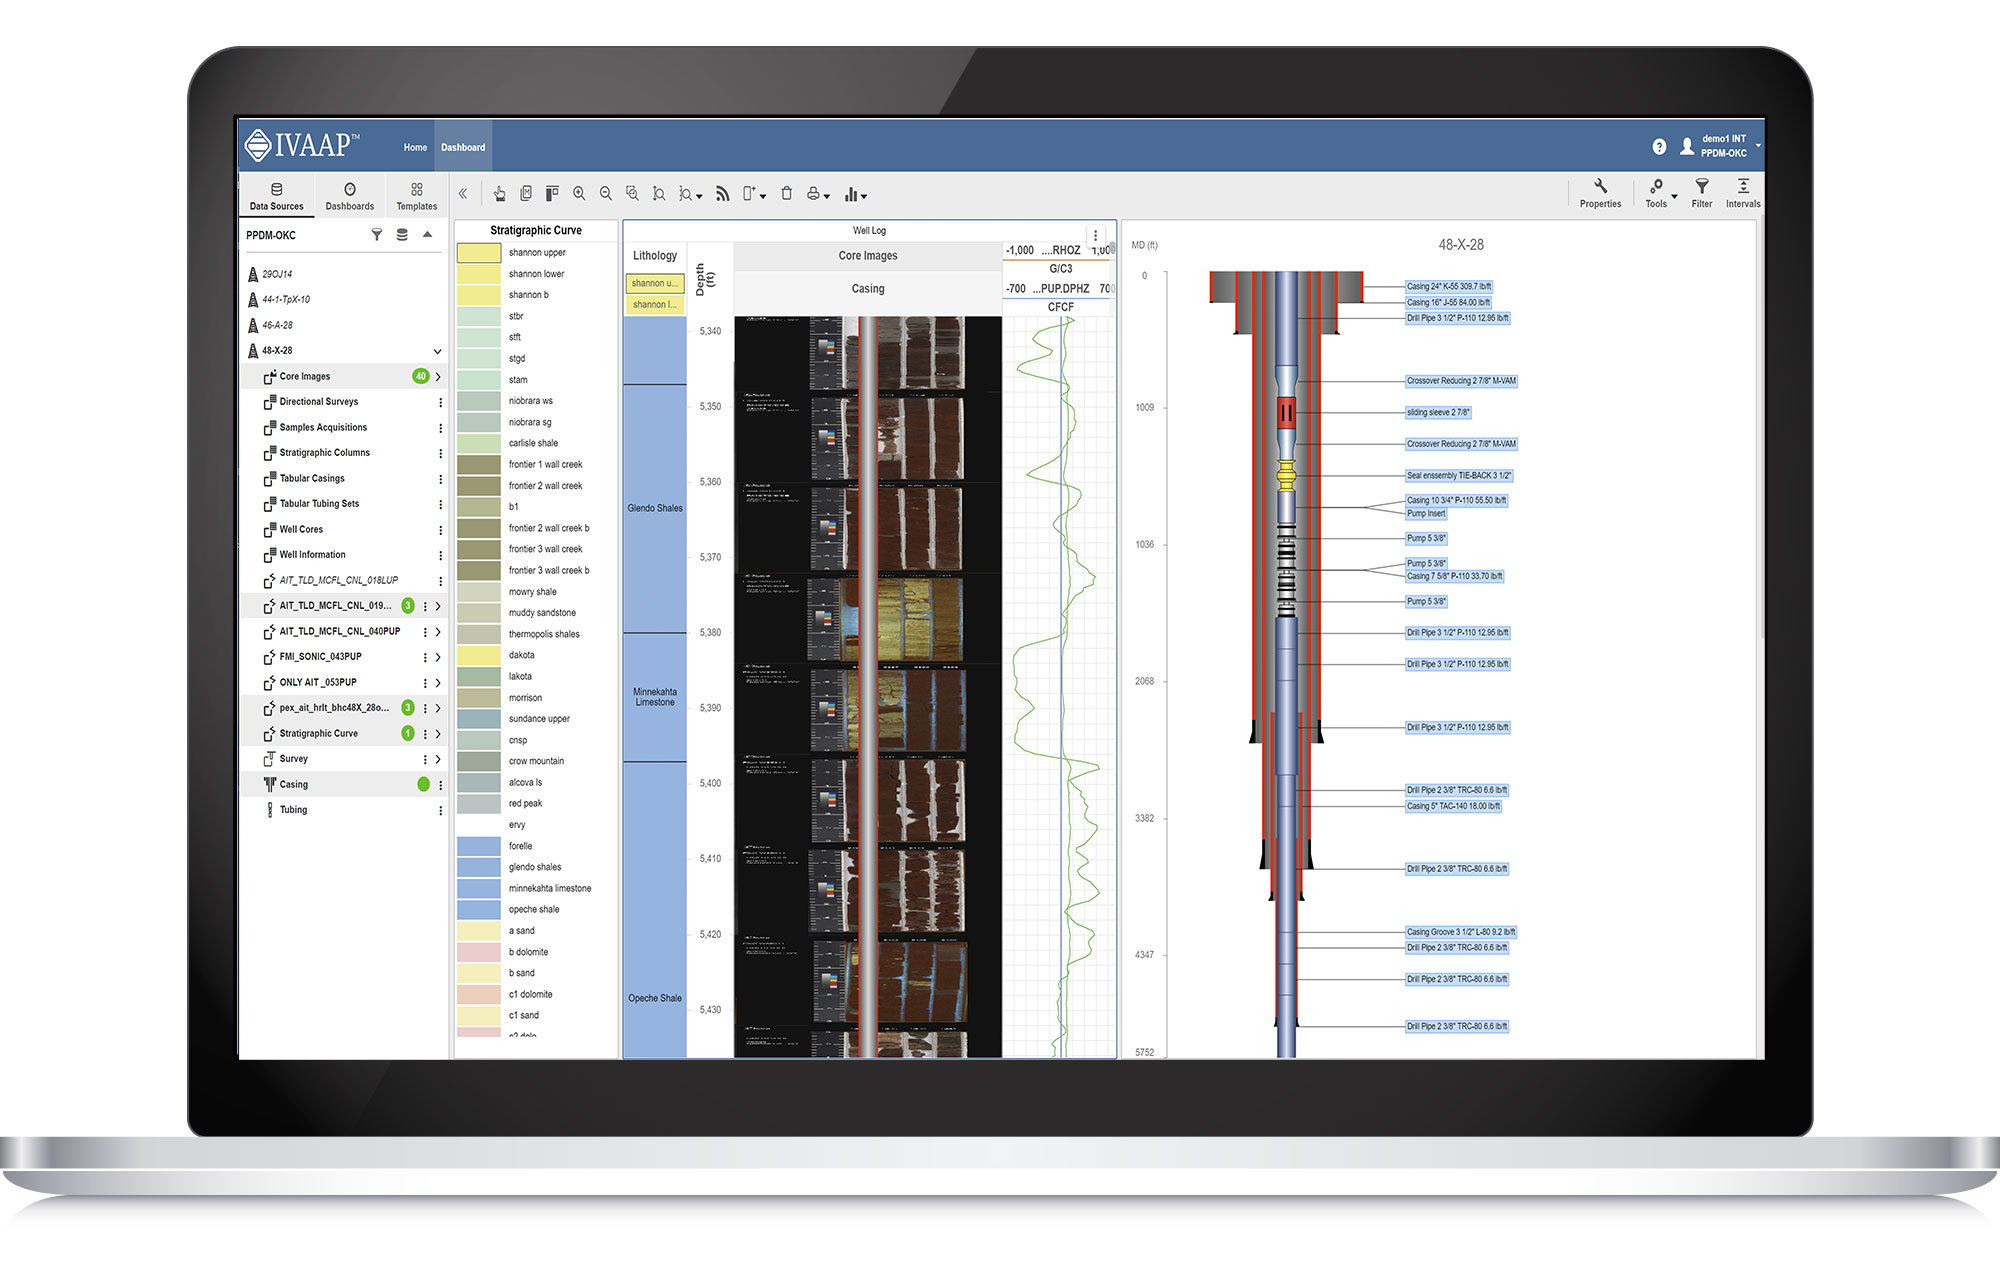
WellLog
Support for single-data, multi-data, multi-parent mode and dynamic range interval
Time or depth-indexed data
View log curve/array curve / discrete curve
Array log vertical interpolation
Log curve line/symbol/value with micro-positioning
Lithologies, annotations, stacked curves, tops, schematics, perforations, casing
Display open hole section, interval curve, raster files, stacked pattern curves
Real-time updates with ascending or descending depth index
Vertical/horizontal orientation
Tadpole
Symbol color filling
Autofit to quickly scan multiple wells
PDF Printing
Curve value tooltip at the cursor position
Cutoff mode
Multiple indexes with different unit
Drag & Drop a log to display all curves
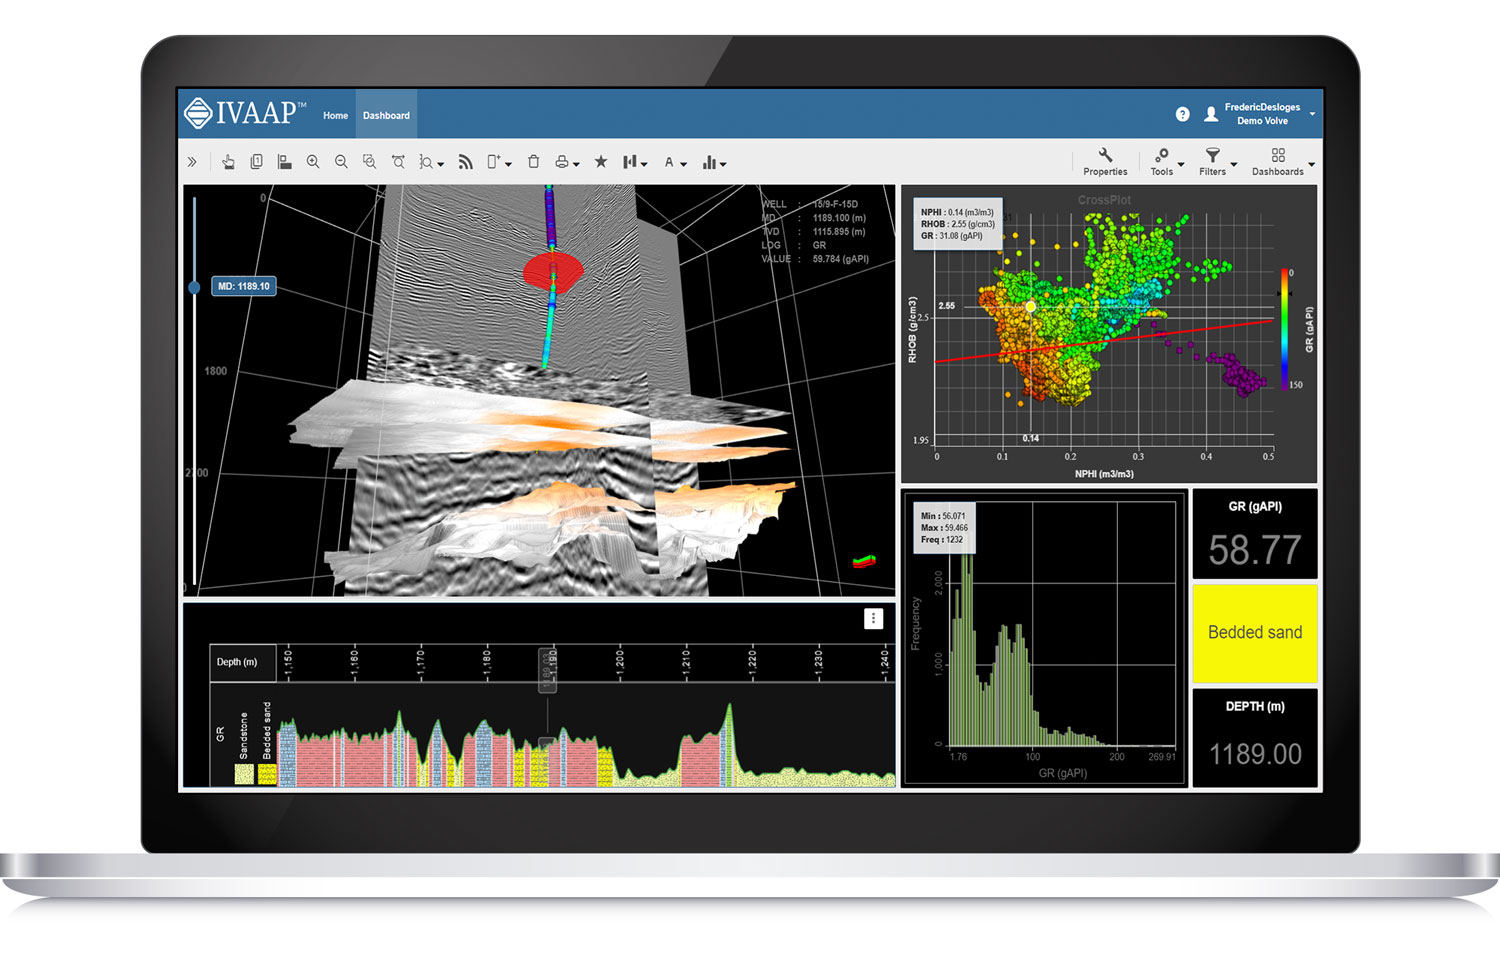
3D View
2D seismic, multiple inlines, crossline, time slice/depth slices, arbitrary line
Surface map, horizons, faults and fault sets, reservoir grid, and properties
Wellhead, well tops, correlation, and trajectory fence
Trajectory line & tube
Survey stations
Drag & drop multiple objects from the data tree
Curve tube, cylinder log, and plane log
Inlines/crosslines and horizons, surfaces, faults, triangle mesh, reservoir
Highlight selected object
Property change to objects
Trajectory vertical elevation
3D crosshair with projection on 2D plans
AGC noise reduction
Data with no CRS
Seismic support for transparency
Contour lines on horizons and grid surfaces
Well casing, casing shoe, tubing, perforations
Calculate reservoir volume
Seismic support for ZFP compression
2D Seismic
Inline, crossline, horizons
SEG-Y / SU / SEP / JavaSeis / ProMAX / SEGD / SEG2 / OpenZGY / OpenVDS
Seismic compression
Seismic survey
Wiggles
Variable and interpolated density
Positive and negative fill with solid color or gradient
Reverse polarity and gradient option
Display gaps in seismic profile
Binary/EBCDIC copy to clipboard
EBCDIC information
VDS 2D dataset support
Header information dialog
Filter / AGC / Reverse processors
Fault display support and editing
Support different scales between inline, crossline, slice
Support for ZFP compression and overlay display
Spectrum
Seismic data spectrum
Multiple parts of data in one chart
Time and depth domain data
Amplitude, dB Linear, Phase, Wrapped Phase, Power Modes
Filtering / Windowing / Smoothing / Phase Trend Removal processors
Time Series Chart
Display one or multiple time series
Support for color filling between series, state definition, real-time, table data, annotations, perforations, logarithmic mode.
Drag & drop log displays all curves
Change the display order of data series
Well Section
Vertical fence (TVDSS v. Measured Depth)
Option for project ahead trajectory display
Seismic background
Welllog template
Well tops
Correlation Display
Add/remove wells
Apply well log template
Zoom in/out individually or all wells
Scroll up/down individually or all wells
Reset well position
Synchronize spacing between wells
Apply well log template
Horizontal scale
Add/remove tops
Raster log support
Switch raster log
Curve dictionary and curve aliases
Create correlation fence from Correlation widget and edit in Map widget
Interval name in top state definition
Ghost curve
Align Wells to top or bottom measure depth
Definition for colors and pattern created from displayed tops
Switchindex between MD, TVD, TVDSS
Top unconformity
Dispay well group in well header
Flatten on top
Flatten on index value
Support for proportional distances between wells
Print to PDF
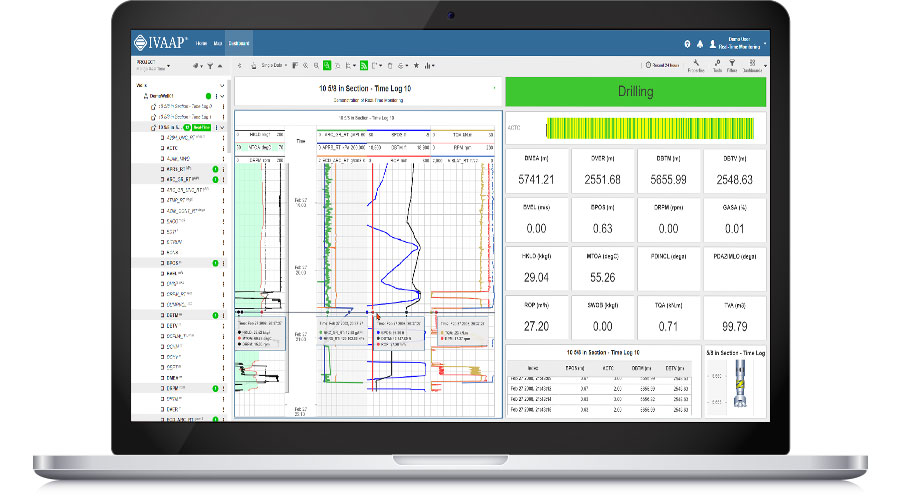
Drilling Status
Real-time BHA position
Zoom in and out
Pre-defined BHAs
Schematics
Display schematic data
Casing, tubing, and BHA
Animated BHA (fluid, debris…)
Cursor tracking with WellLog
Open Hole section and deviated schematics
Tracking with 3D widget
Tabular version display in table widget
Line Chart
XY line chart with the option for markers display
Multiple data series
Wellpath in 3D View widget
Annotations
Manage display order of data series
TableView
Log curve
Multi-dataset
Real-time updates
State definitions
Lock on name
State definition from the widget
Column (filter, align)
Header wrapping
Column sorting
Formatting for each column
Display top set table
Cell wrapping
Pivot table
Calculate statistics
Spreadsheet table
Curve dictionary and Curve aliases
Shapefile and GeoTIFF in tabular form
Drag and drop a log displays all curves
Lock on Type
Duplicated curve names
Specific depth index
Edit and search for curve values
Delete multiple rows of a log
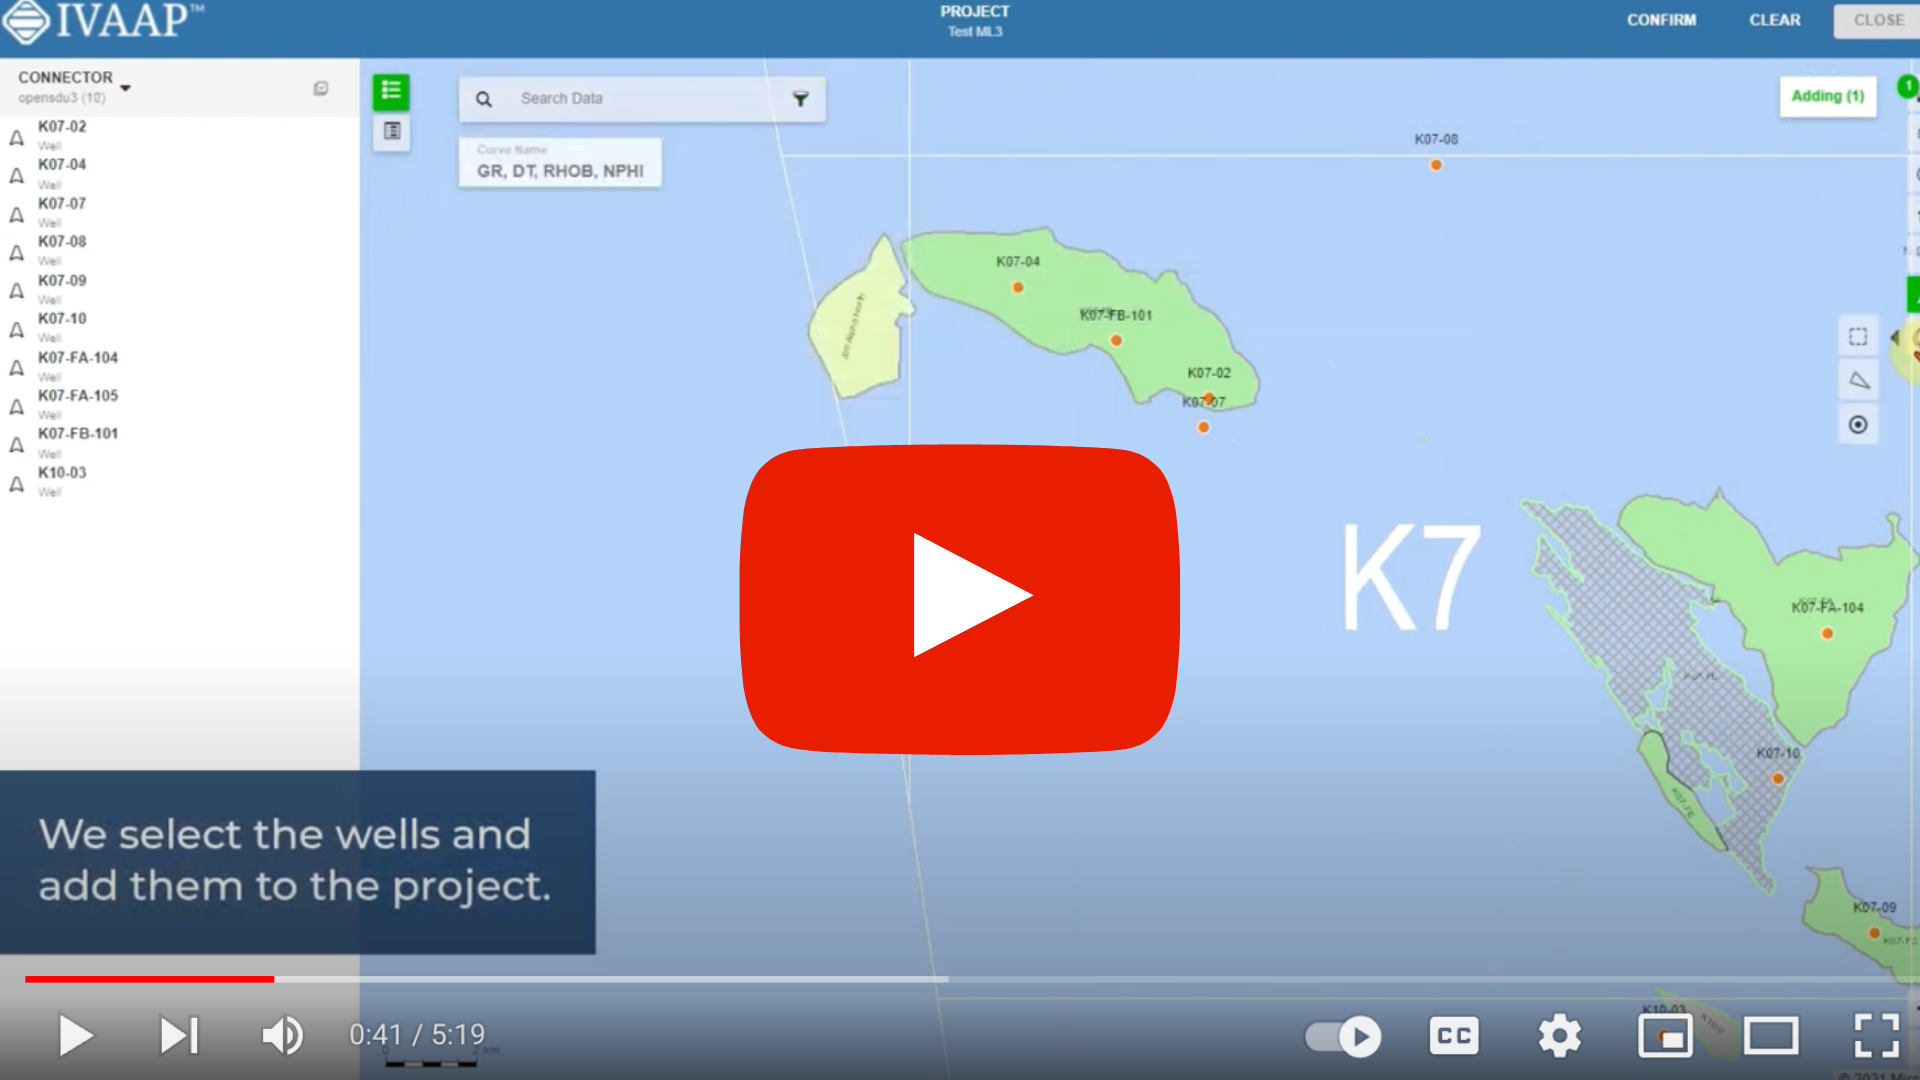
Map
Web Map Tile Service (WMTS): Google, Bing, OpenStreetView…
GeoJSON
Multiple Feature Layers
ArcGIS Feature layer
Seismic lines
Bing Aerial Maps
Wellhead location
Well correlation fence
Seismic line and wells
Individual or area selection
Shapefiles
GeoTiff
Well symbols
Basemap
Seismic slices, inline, cross-lines
Horizons, grid surfaces, triangle mesh, faults
Reservoir layer
Well locations, well trajectories
Drag & drop multiple objects
Contours & transparency
Export to PDF
Correlation fence line
Create and edit arbitrary lines
Well symbols
Reservoir property support for logarithmic mode
Support editing order of displayed objects, polygon, reservoir compression
Bar Chart
Discrete curve
Continuous curve with state definition
Table data
Real-time update
Dynamic Range Intervals
Pie Chart
Tabular data
Discrete curve
Continuous curve with state definition
Real-time update
Dynamic range intervals
Histogram
Analyze seismic data distribution
Support frequency types: absolute, normalized, relative
Export to PDF
State definition
Curve dictionary and Curve aliases
Pivot Table
Calculate statistics
Aggregate table data
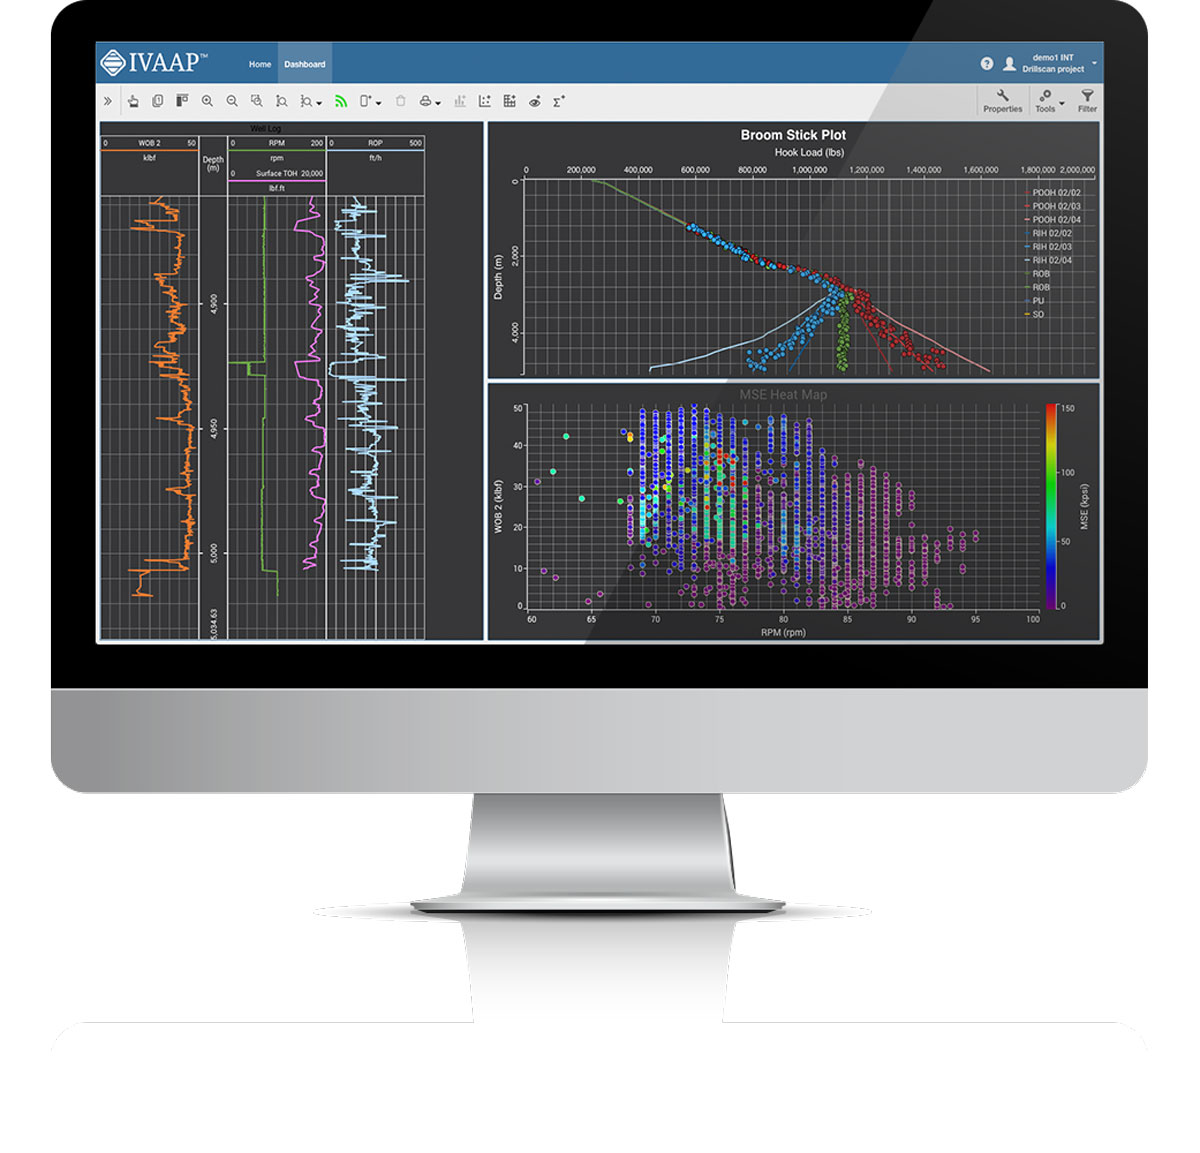
Scatter Plot / Crossplot
Third dimension using gradient color or state definition
Curve dictionary and Curve aliases
Regression line linear and non-linear
Discrete editing
Export to PDF
Highlighting based on basemap polygon
Support for interval data as Z axis, horizon attributes and dynamic range intervals
Value Tracker
Log curve value
Multi-dataset
Real-time updates
State definition
Curve dictionary and Curve aliases support
Report
Custom reporting dashboards
Tables and metadata
Gauge
Real-time updates
Visual alarms
Gauge types:
Digital
Full Circular
Half Circular
Quarter Circular
Multiple Tracking
Vertical Bar
Horizontal Bar
Real-time gauge to display activity status
Curve dictionary and Curve aliases support
Statistic
Support multi-dataset and dynamic range intervals
HTML
iFrame support
Time or Depth indexed data
Support switching between well and wellbore
Title Widget
Display data set name
Option for free text
Metadata keywords
Image Widget
PNG, JPEG, and TIFF files
Diagram Widget
SVG files
Animations
Dynamic binding
Tabular data
![What Is IVAAP [Overview]](https://www.int.com/wp-content/uploads/2021/06/Screen-Shot-2021-06-24-at-9.40.02-AM-1024x578.png)