Staatsolie Streamlines Data Access and Visualization with INT’s IVAAP
“Considering the current challenges in O&G, companies must look for ways to improve operations and find efficiencies. The IVAAP platform eliminates redundant applications, streamlines data access and analysis, and improves our operational efficiency significantly. We expect to find 30% improvement across the board.”
—Vikash Rambaran Mishre, E&P Information Management & Technology Administrator, Staatsolie N.V.
As with many oil and gas companies in today’s environment, Staatsolie struggled with the overwhelming amount of data generated daily and found it very challenging to cope with the increasing demand for data access, reporting, and visualization services throughout the Company.
Historically, Staatsolie’s data was siloed in various specialized applications, reformatted and edited multiple times in transit, restricted by a cumbersome search process, and shared via email or FTP.
Data spread out across various locations and in multiple applications made it difficult, expensive, and time-consuming to share the right data with the right people quickly and made it nearly impossible to display or report the different data types in an integrated manner.
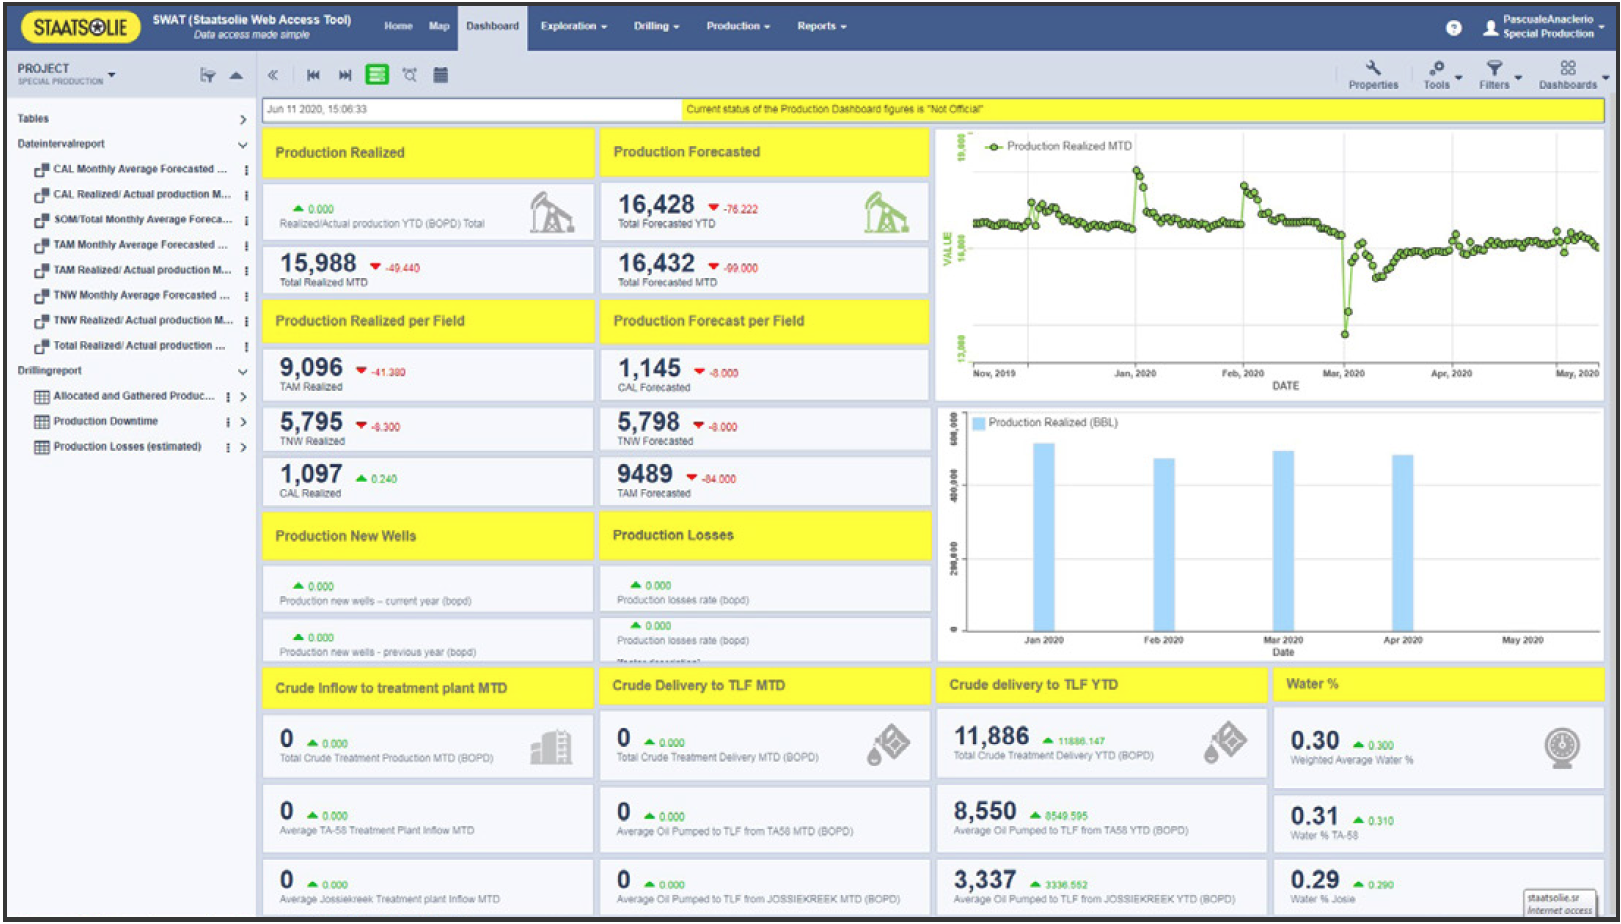
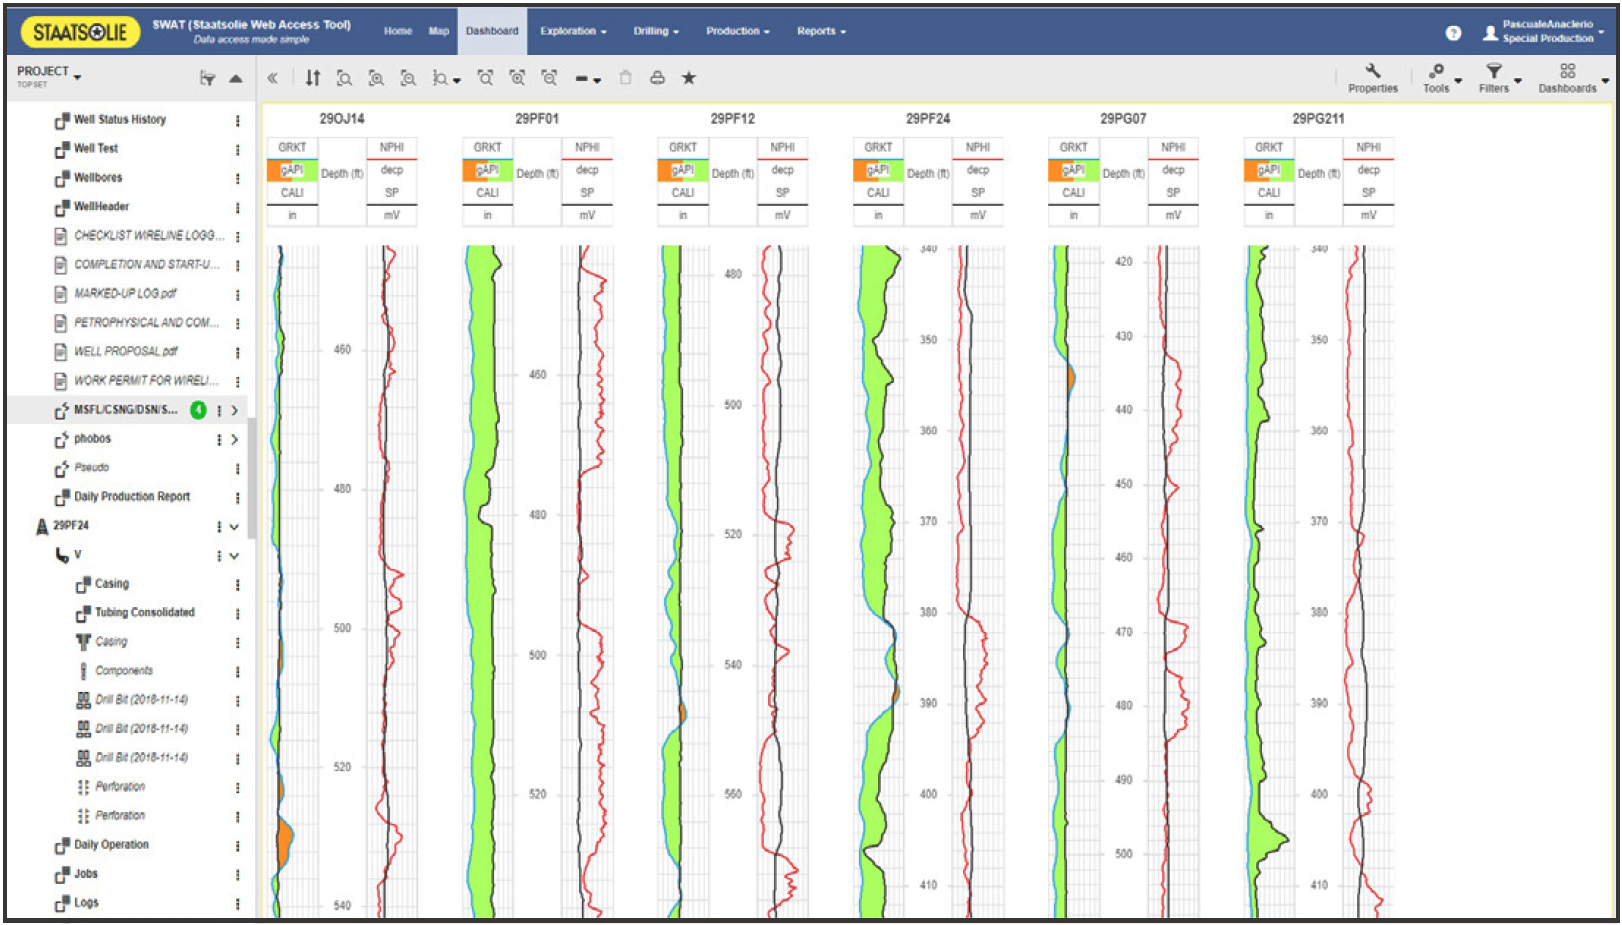
Staatsolie had a need for an integrated data reporting/visualization tool, and IVAAP met the requirements for it. Visualization was an isolated component of the data environment, performed mostly in Excel, and limited to one view of one data set by one user at a time. Additionally, each user calculated each visualization in a different way, resulting in different and sometimes problematic analysis across the team.
To optimize their operations, Staatsolie saw the implementation of IVAAP as an opportunity to establish a web-based solution that would allow their upstream users to perform all key capabilities: online search, integration, sharing, visualization, reporting, and metrics in one application on the web.
Solution: A Single Access Point for Upstream Data
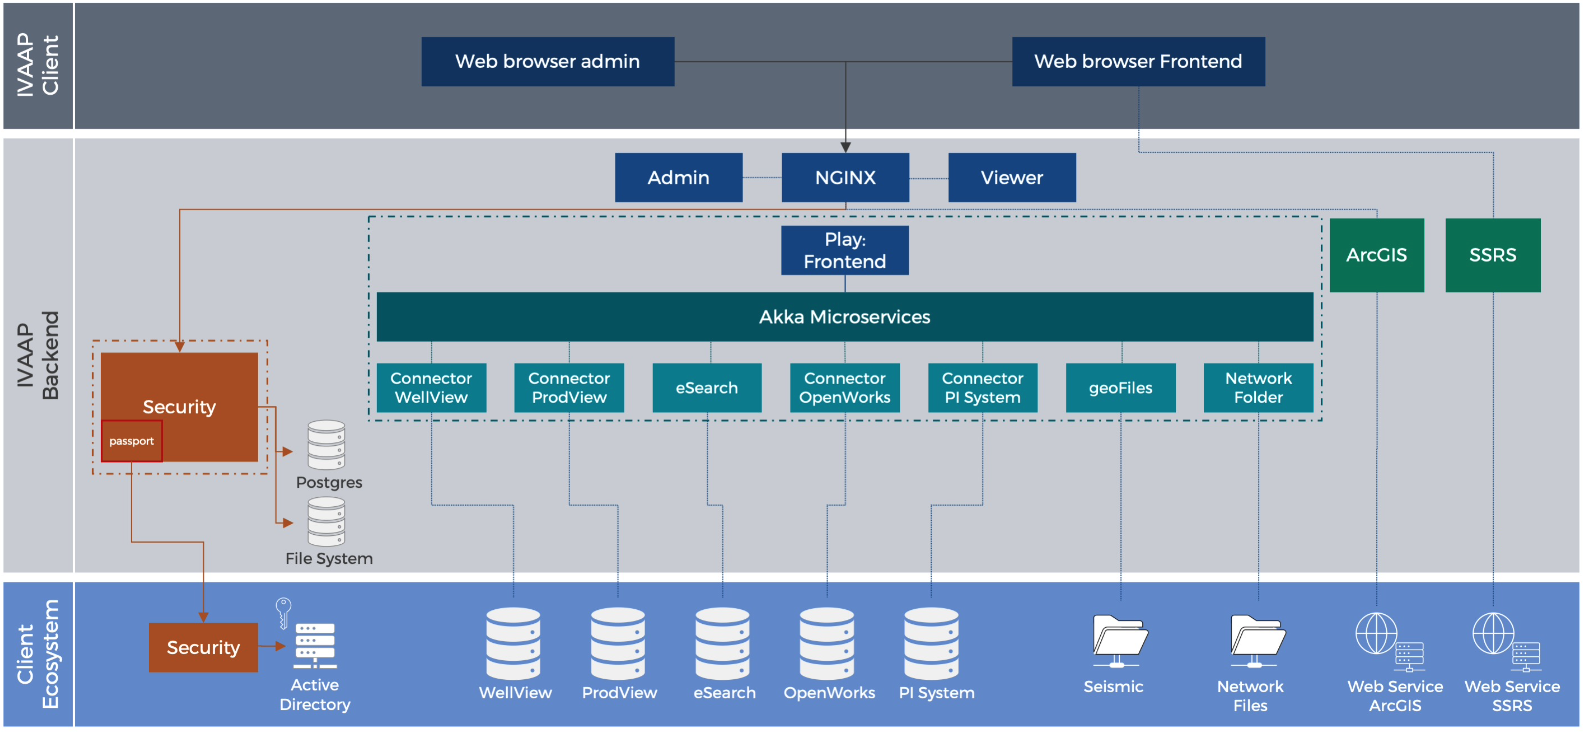
After evaluating more than 20 competitive solutions, Staatsolie chose INT’s IVAAP platform based on its ability to centralize data access, provide custom search capabilities, offer powerful visualization, and streamline performance monitoring, all in one platform with minimal complexity.
Backed by INT’s extensive domain experience, IVAAP aggregates nearly all domain data formats and offers custom SDK and APIs to integrate additional formats and functionality as needed. IVAAP allows Staatsolie to consolidate workflows and eliminate unnecessary applications and is data-agnostic, meaning Staatsolie’s proprietary data and algorithms are kept secure. A robust Admin makes it easy for managers to create and manage groups to restrict access to data.
INT also provides a support team that works closely with the implementation team to provide stellar technical support quickly and efficiently throughout the process.
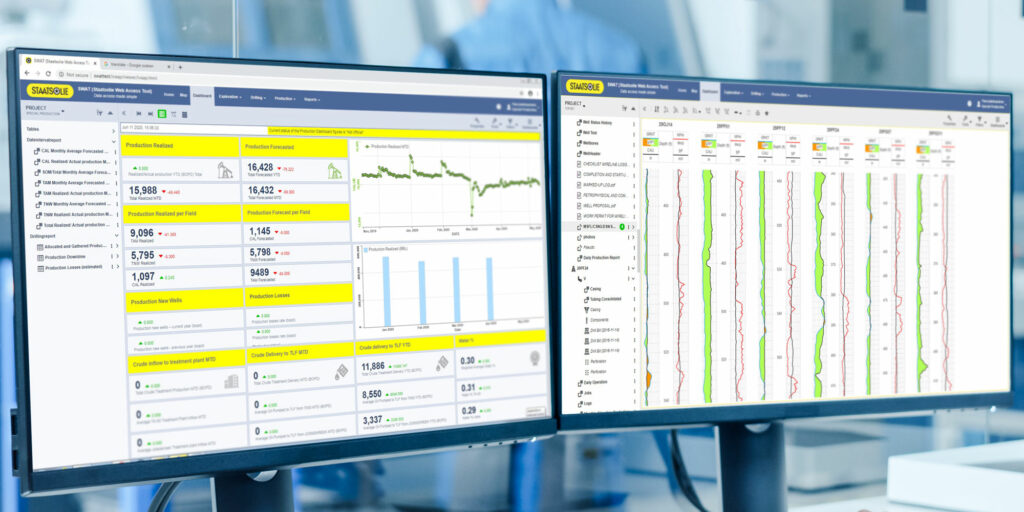
Staatsolie now has a faster, centralized decision- making process, with all analysts, managers, and stakeholders able to view data from different sources all together in the same dashboard. Monitoring company and operational performance (BI, KPI) online in real time means the company has realized its goal to become more data-driven. Overall, choosing IVAAP allowed Staatsolie to reduce operating and capital expense, improve efficiency and productivity, and enhance effectiveness of decisions made across the Company.
Benefits: Expected 30% Operational Efficiency
In a typical workflow, retrieving and formatting data took anywhere from 30 minutes to an hour per data set. With nearly 70 Staatsolie users spread across groups and in different locations, this wasted time and effort added up. Providing those users with licenses for each system and manually setting up groups to restrict data to certain users compounded the cost.
Now, with IVAAP, access, search, and visualization are centralized in one platform and accessed easily on the web. Users see one screen using one algorithm, eliminating the potential for errors and creating a data-driven, collaborative environment that reduces operational risk.
See how IVAAP can help you achieve your objectives with a free demo.