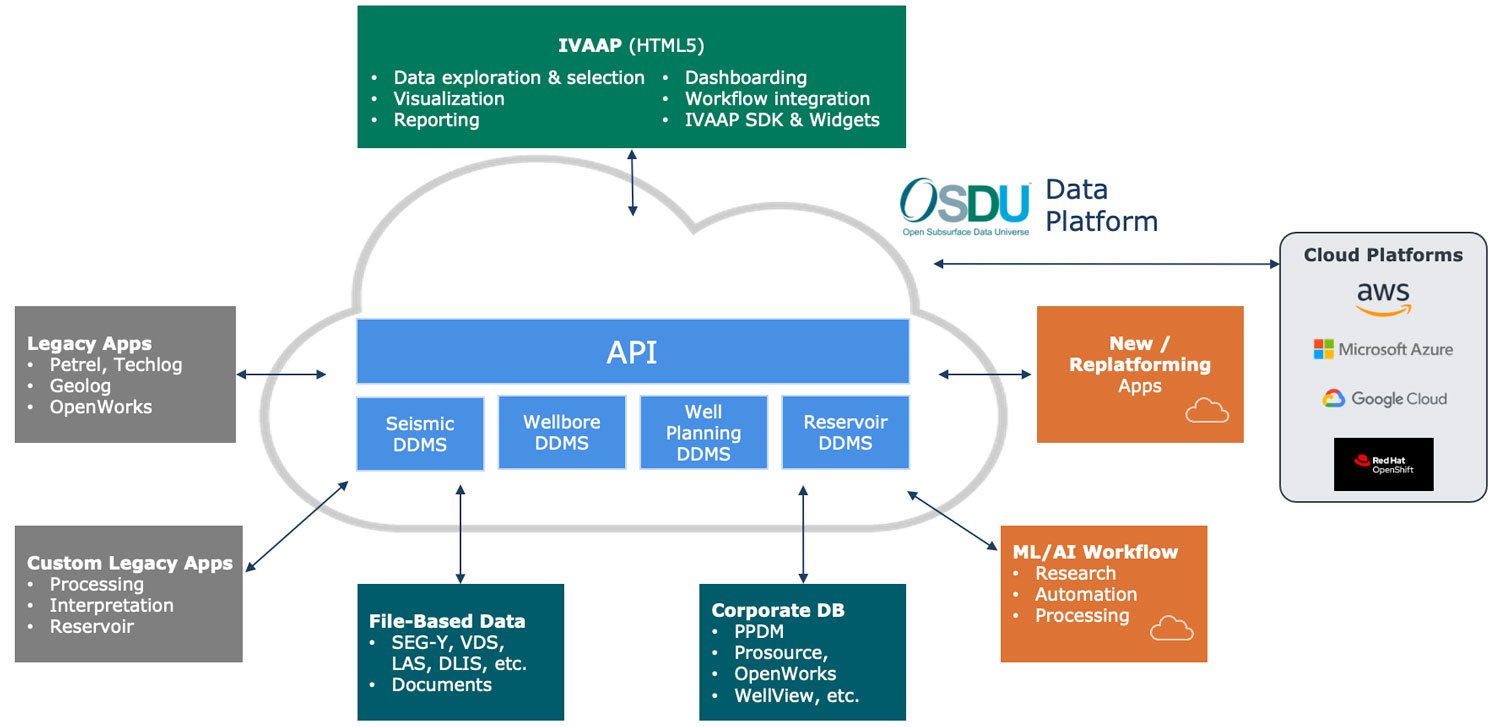
Flexible, Versatile Architecture
Fully integrated with OSDU, IVAAP can support multiple application interoperability strategies:
1. Operators can re-platform legacy applications to leverage existing ML, processing and make them accessible in the cloud using IVAAP as their front-end.
2. Operators can also extend their applications portfolio with new apps where IVAAP can quickly be integrated to offer a UI with key capabilities to access and visualize the data.
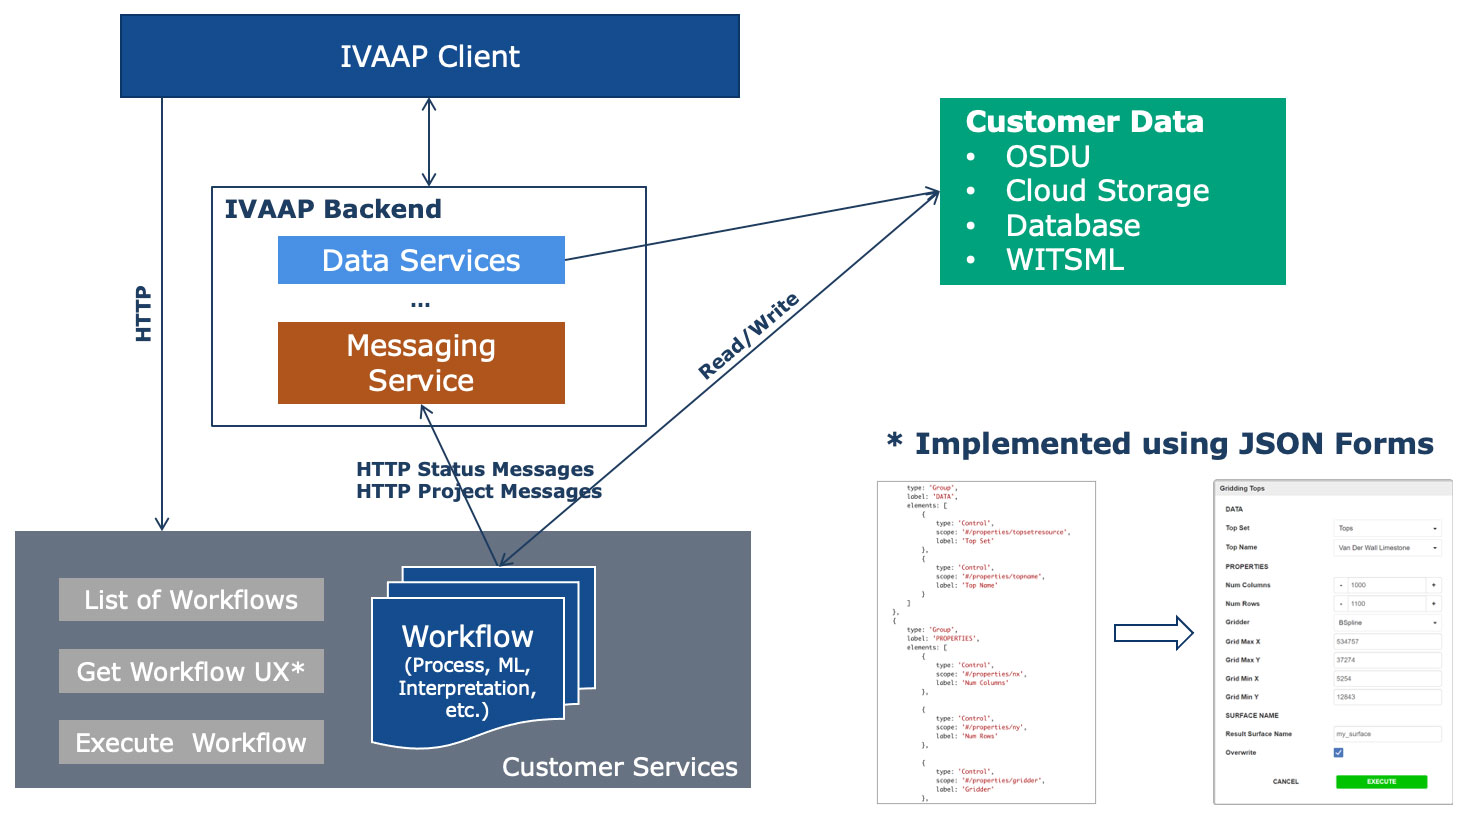
Here is a more detailed view of the various possibilities provided with IVAAP.