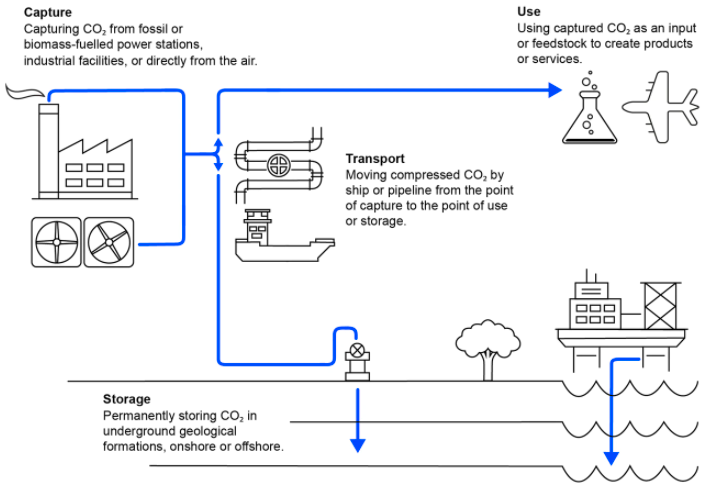
Developing Innovative CCUS Technology Solutions
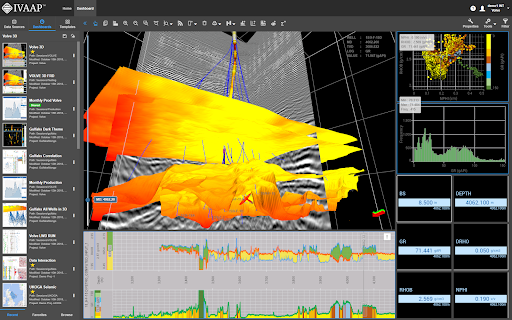
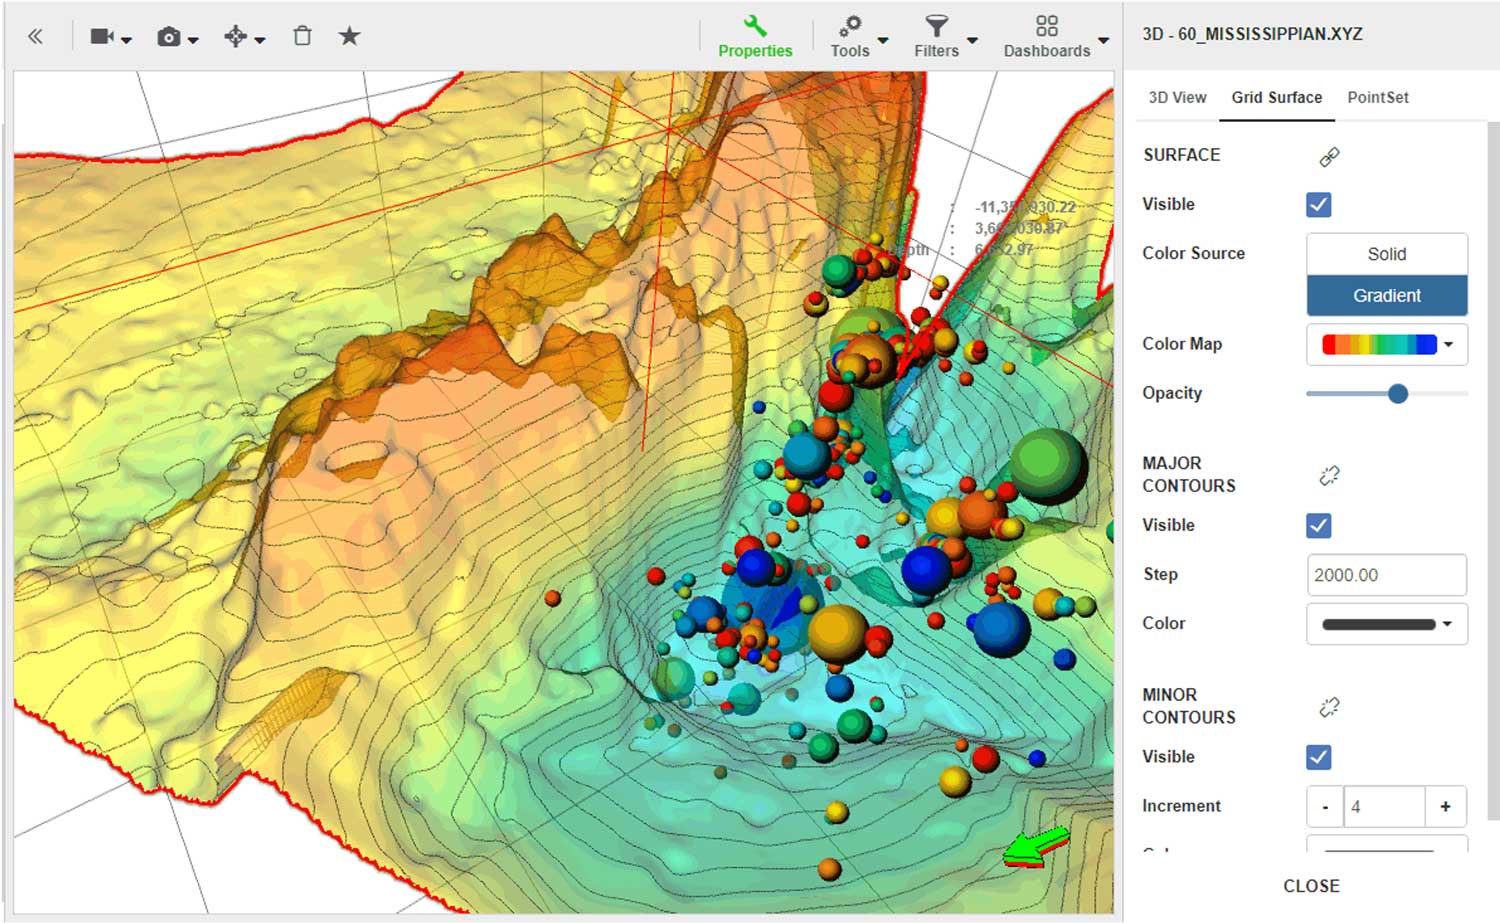
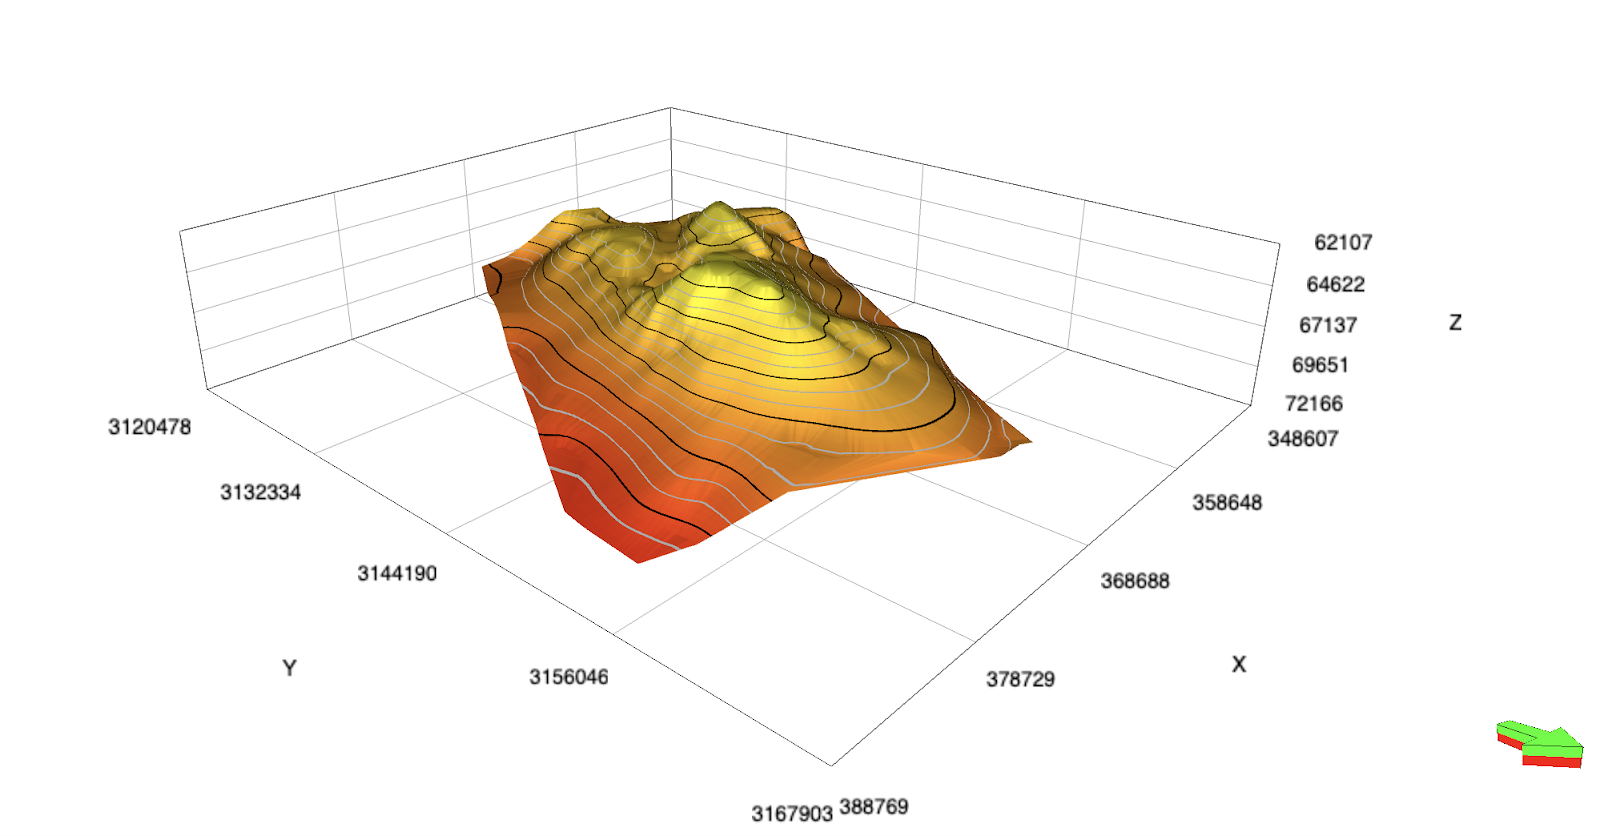
As developers build new applications to manage each CCUS lifecycle phase, INT provides the visualization technology to empower geoscientists, drillers, and operators with the right visualizations to make key decisions.
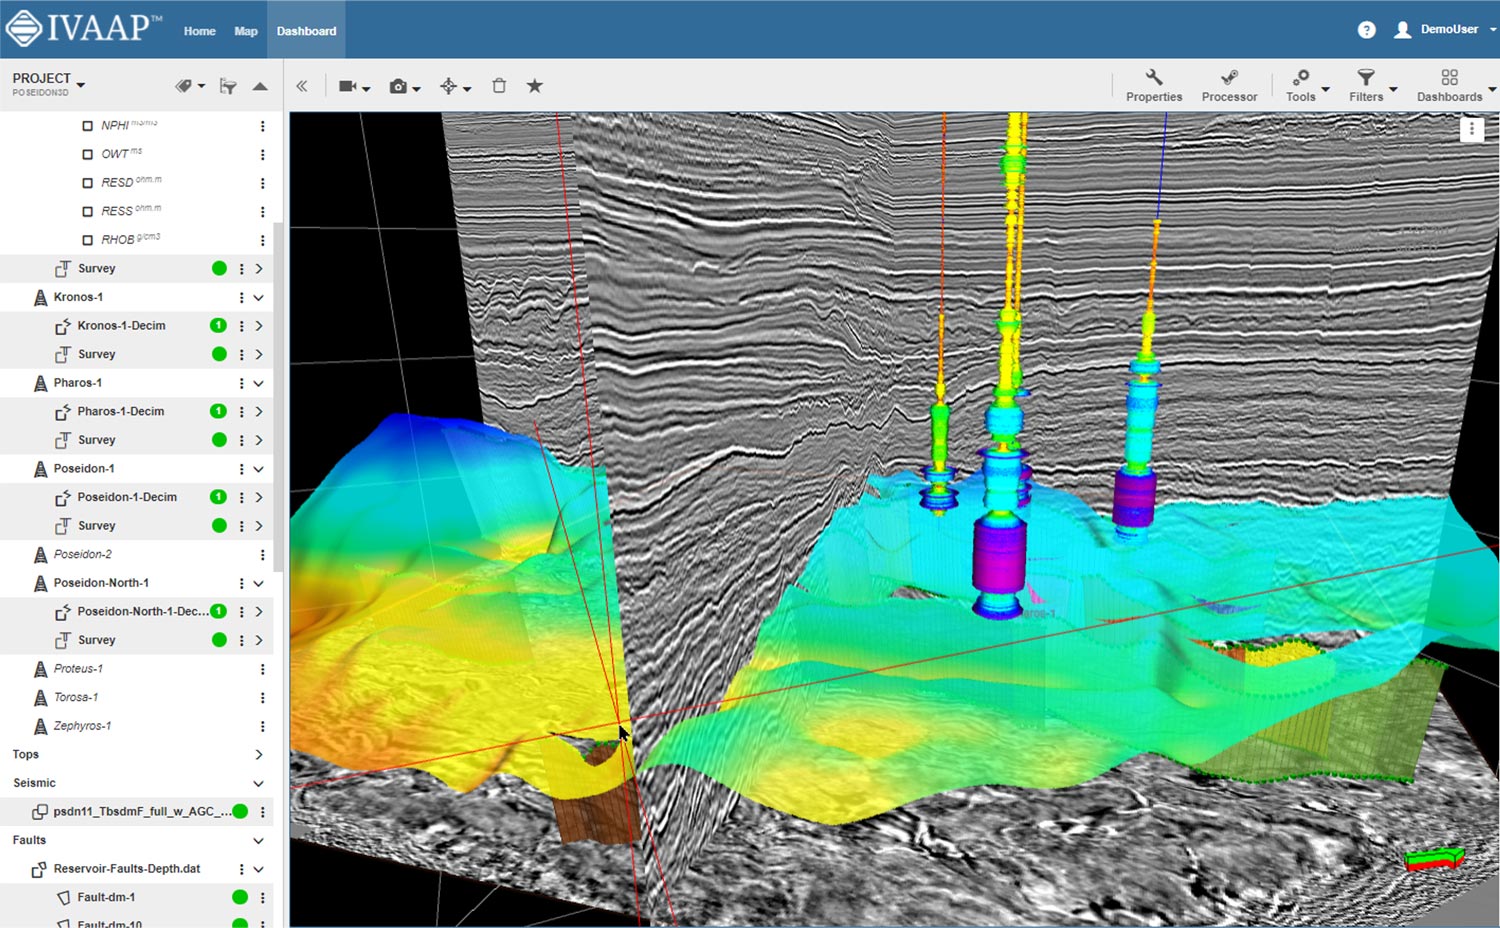
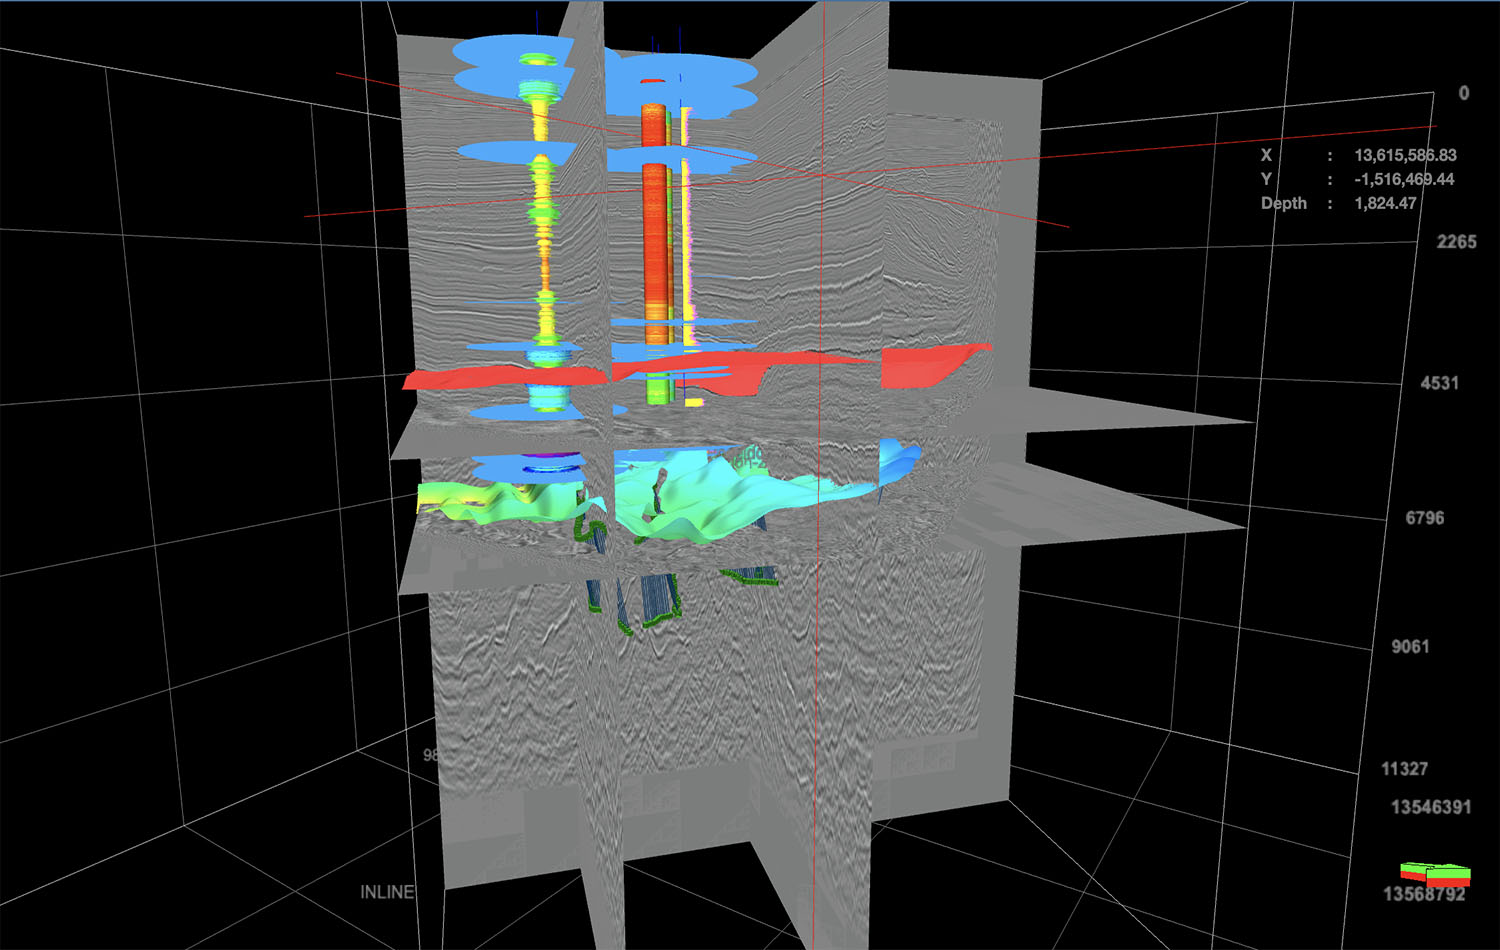
INT’s advanced visualization libraries (GeoToolkit) display required views for geoscientists and operators—from temperature levels, pressure, flow, 3D reservoir, and well models, and more—to monitor each step in the CCUS lifecycle, from capture and compression to storage. GeoToolkit’s flexibility means a smoother transition to new energy software applications in a fraction of the time.