Enterprise Data Visualization

Visualize, Analyze, and Share Scientific and Operational Data — Deployable and Accessible from Anywhere

With IVAAP, the same code and the same application are deployable on a rig or in any Cloud Services Provider (CSP). IVAAP comes with standard connectors to CSPs such as AWS, Microsoft Azure, or Google Cloud Platform. IVAAP connectors have been optimized for reading objects with almost every vendor library with the highest performance. IVAAP’s SDK can be used to create new connectors to other CSPs (IBM Cloud, etc…).

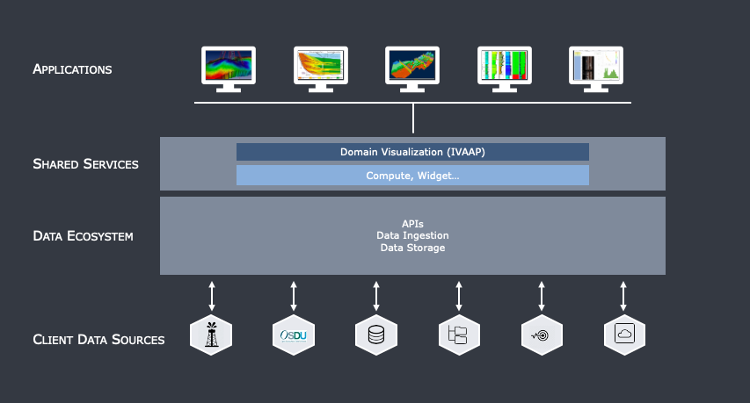
IVAAP’s architecture can support a deployment strategy for private cloud, on-premise, or a hybrid data storage model:

IVAAP-Architecture-043020

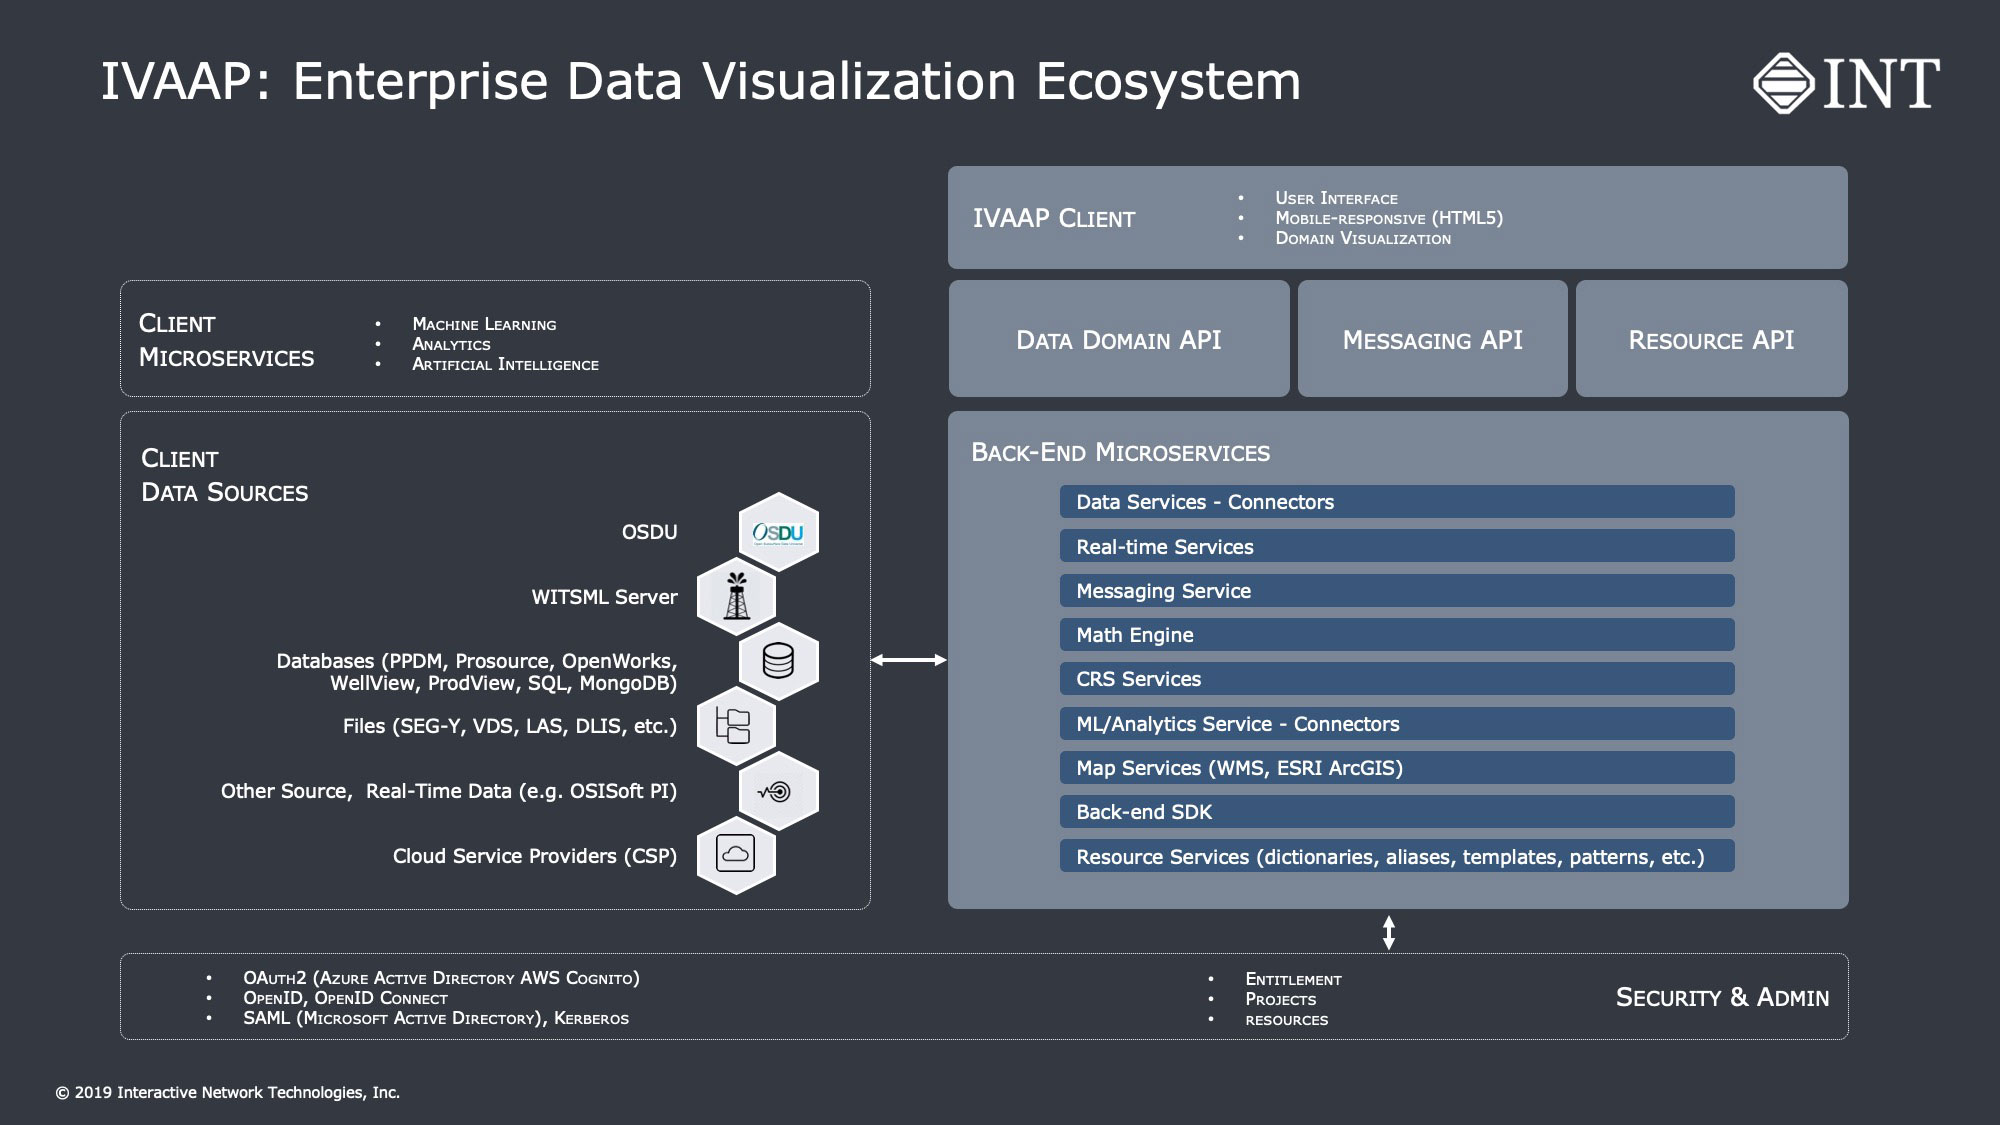
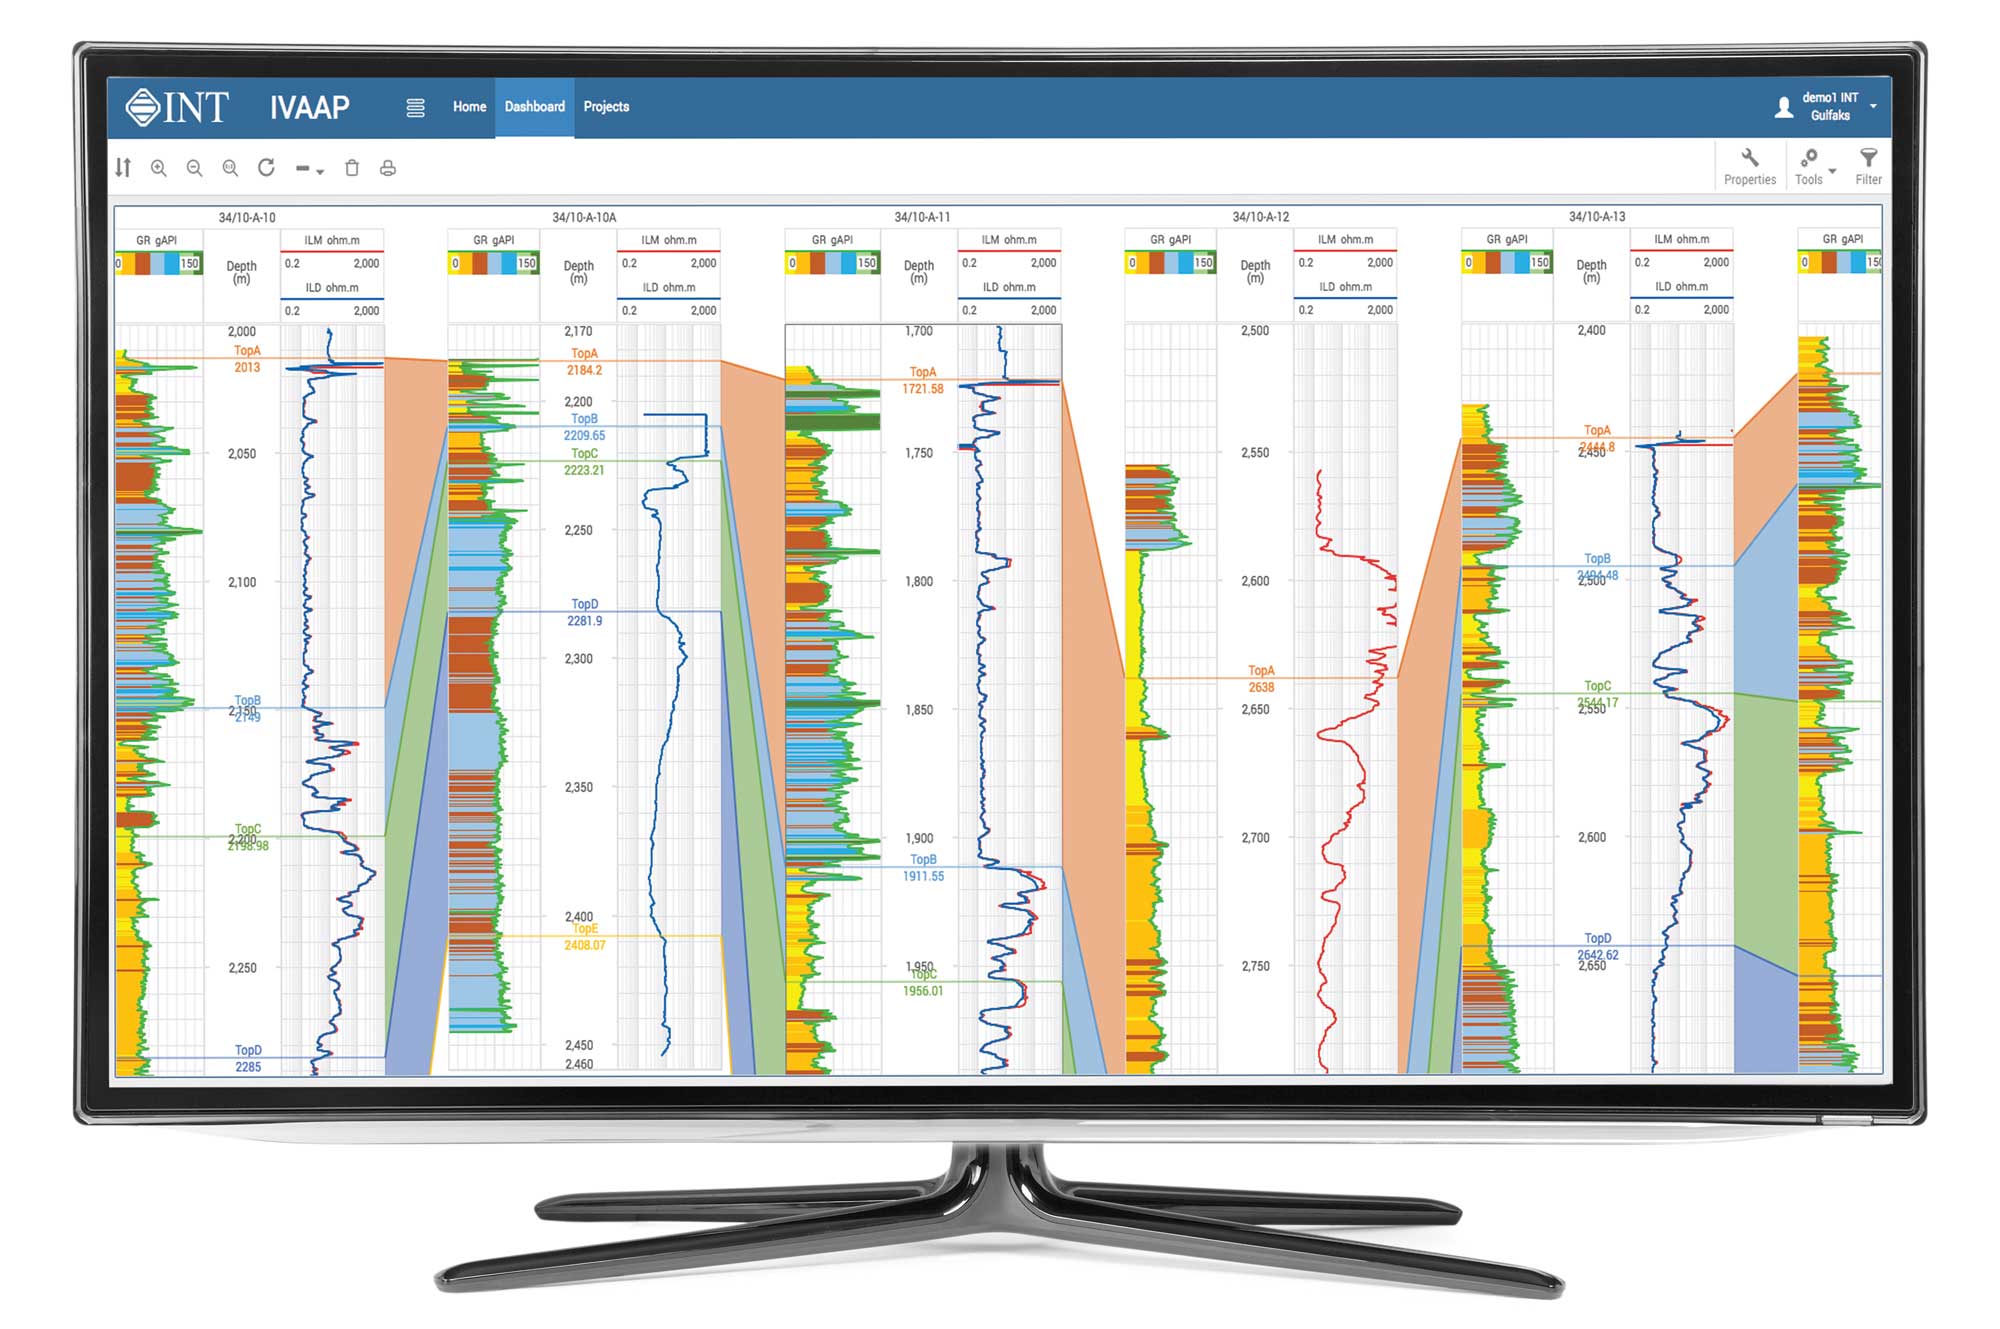
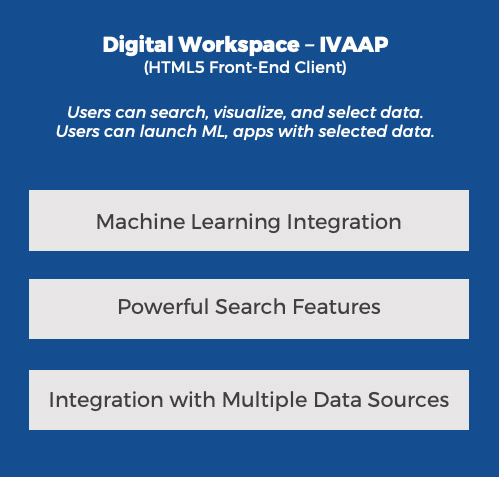
IVAAP’s front-end client is built in HTML5. Using JavaScript, IVAAP provides the optimal user experience in a web browser to navigate and interact with large datasets.

Finally, because remote access to sensitive data raises concerns about access and protection, IVAAP integrates with existing security models and methods in place in a company. IVAAP supports SAML, Active Directory, and security at the object level. We know that the security of data—now and in the future—is of paramount importance. Our tools are data-agnostic, meaning we don’t store your data or your algorithms, and your data stays protected.


See What IVAAP Can Do

Request a Demo

multiwell-IVAAP-web

Cloud with No Compromise on Performance

When it comes to exploring and analyzing complex data (seismic, millions of traces, real-time data feeds at 10 to 50hz refresh rate), the massive scale, growth, and variety can be too much for traditional applications to handle. With GeoToolkit and IVAAP, you can display complex data easily—more than 500 wells simultaneously—decimate data selectively, and handle large datasets easily with fast compression and decompression.

Choosing a data visualization technology that can perform at scale and facilitate moving massive amounts of data to the cloud can be challenging. You need a platform that can provide seamless access, deliver top performance, and offer an intuitive user experience. Rendering accurate and crisp visualization in real-time can mean the difference between making a good business decision and a leading-edge innovation. Our software can handle any dataset and nearly any data type, from a few data points to millions. IVAAP does this and more.

Request a Demo

Designed for Enterprise and Machine Learning at Scale

For architects, component reusability is key to reducing costs and shortening time to deliver digital solutions. You used to have to rebuild everything from scratch, which ended up being very expensive since corporations have large portfolios of applications to develop and maintain (surveyed companies have 200+ applications in the energy app portfolio).

IVAAP reinvented the old way of rebuilding from the ground up, meaning you can share components and exchange information between applications. IVAAP’s versatile architecture leverages the same technology across the enterprise in multiple applications so you can start using visualization as a shared service component.

ivaap-graphic

For example, a display of well log visuals could be used in a drilling application as well as within a wireline application. Sharing the same APIs, the same code stack, and similar ways to embed the visuals into an HTML5 framework is a faster way to deliver these visuals as opposed to working and maintaining using two different sets of libraries. Code reusability allows for consistency across multiple applications and allows developers to focus on other complex problems instead of having to spend countless hours writing front-end displays.  

Empower Machine Learning and Artificial Intelligence

Two of the challenges that upstream majors face include: How to make subsurface data easier to search/discover and how to automate geophysical and petrophysical workflows. Doing either of these manually is time-consuming, costly, and usually done in separate systems. This is where machine learning comes in.

Based on the latest interviews and discussions with geoscientists, here is the most common visualization workflow requested. This basic workflow is important to start automating calculations with machine learning: select some relevant data, select computational functions and run it, and visualize the output—all done from the same system.

ivaap-workspace-graphic-web2

Subsurface Digital Workspace Building Blocks

The illustration shows the building blocks that are necessary to fully create a viable subsurface digital workspace.

Each component is essential to deliver great user experience and adoption.

In this illustration, IVAAP provides the UI and UX for visualization of G&G and petrophysical data (well, seismic, etc…).

IVAAP integrates with both an existing search engine—for instance, based on Elastic Search—and multiple data sources on-premise or in the cloud (AWS, Azure, Google, IBM).

From a single point of access, geoscientists can search, QC the data, and select it to launch an algorithm, ML programs, etc.

IVAAP integrates with machine learning and artificial intelligence to embed it into your workflows.

digital-workspace

Every Business Is Unique—Let Us Help

Our extensive libraries and customizable widgets make building a tool, application, or dashboard to fit your specific needs an easy process. INT’s knowledgeable team will work side-by-side with you to gather requirements, help define your needs, and deliver custom solutions with the lowest risk and highest reward of any on the market.

Contact us to learn more