Katalyst Data Management
WEBSITE
katalystdm.com
INDUSTRY
Geoscience
INT PRODUCT
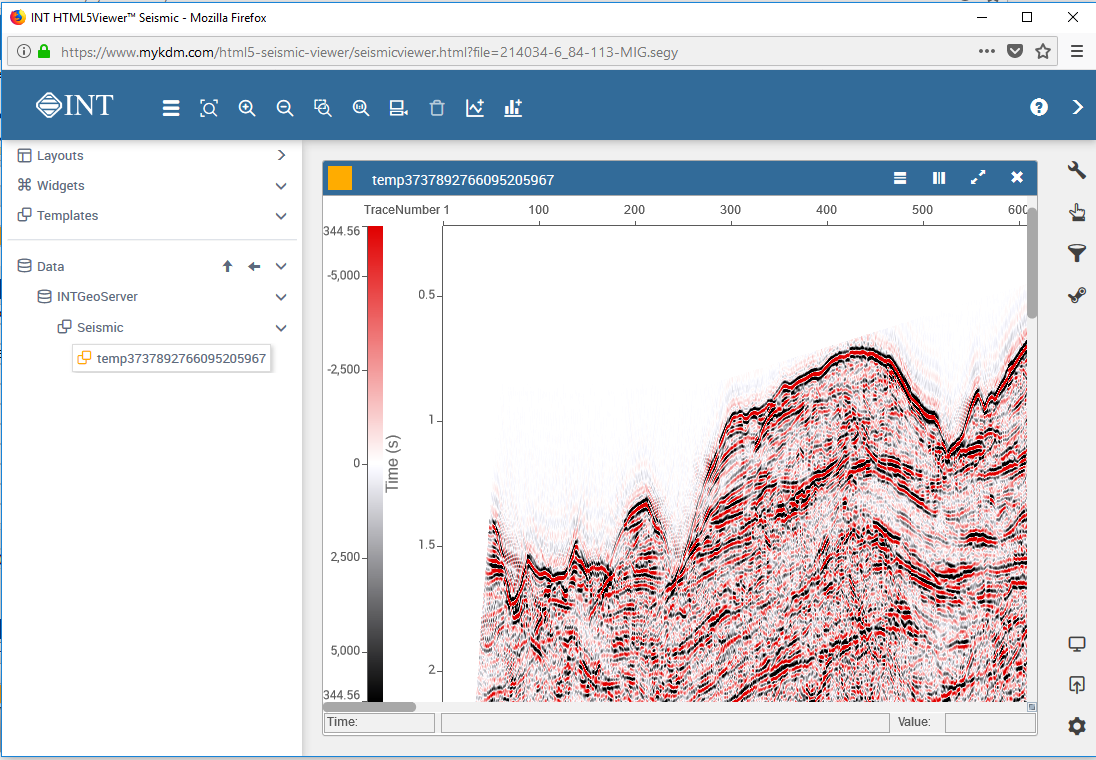
HTML5Viewer
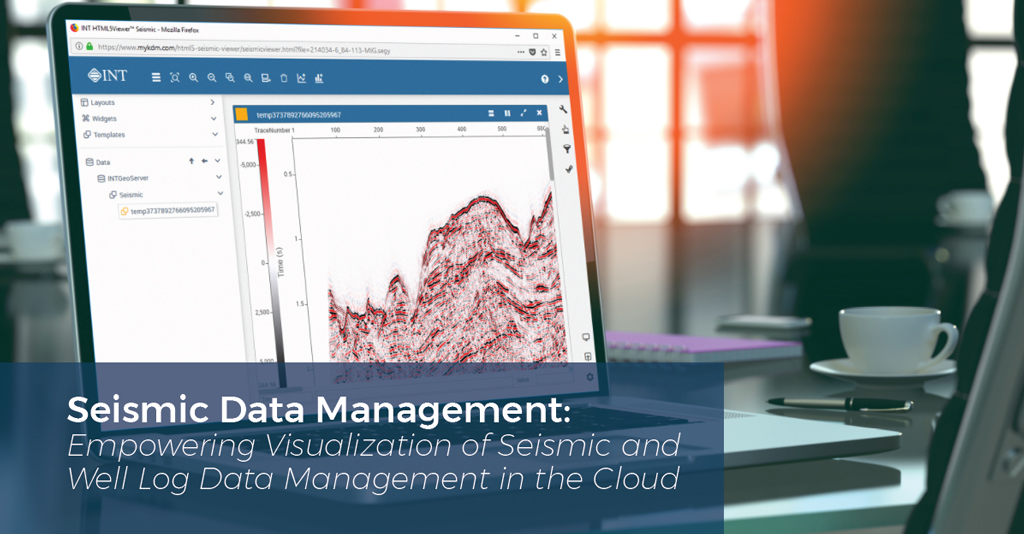
Seismic Data Management:
Empowering Visualization of Seismic and Well Log Data Management in the Cloud
“Our partnership with INT allowed us to expand our product offering beyond just data management to include data visualization. Now, we offer the full data lifecycle, from box to map, acquisition to interpretation-ready to results management.”
—Patrick Meroney, Katalyst Data Management
Overview
For more than 40 years, Katalyst Data Management® has been assisting oil and gas companies with the difficult challenge of managing the vast amount of subsurface data and information acquired for exploration and production. Katalyst’s complete lifecycle solution includes every step in the process, from data capture and verification, to data storage and organization, to marketing seismic data online. Katalyst’s signature offerings include the cloud-based iGlass subsurface data management solution and the e-brokerage site SeismicZone.com for online data marketing.
Challenge
A leader in subsurface data management, Katalyst lacked one critical component to bring the full lifecycle of E&P data to the cloud: They needed a way to display SEG-Y and LAS files online so that their users could check areas of interest to verify data is present and usable. Previous solutions lacked the capacity, flexibility, and range of options to meet their needs. However, building a custom solution from scratch required too much time and money to be a viable option.
INT Solution
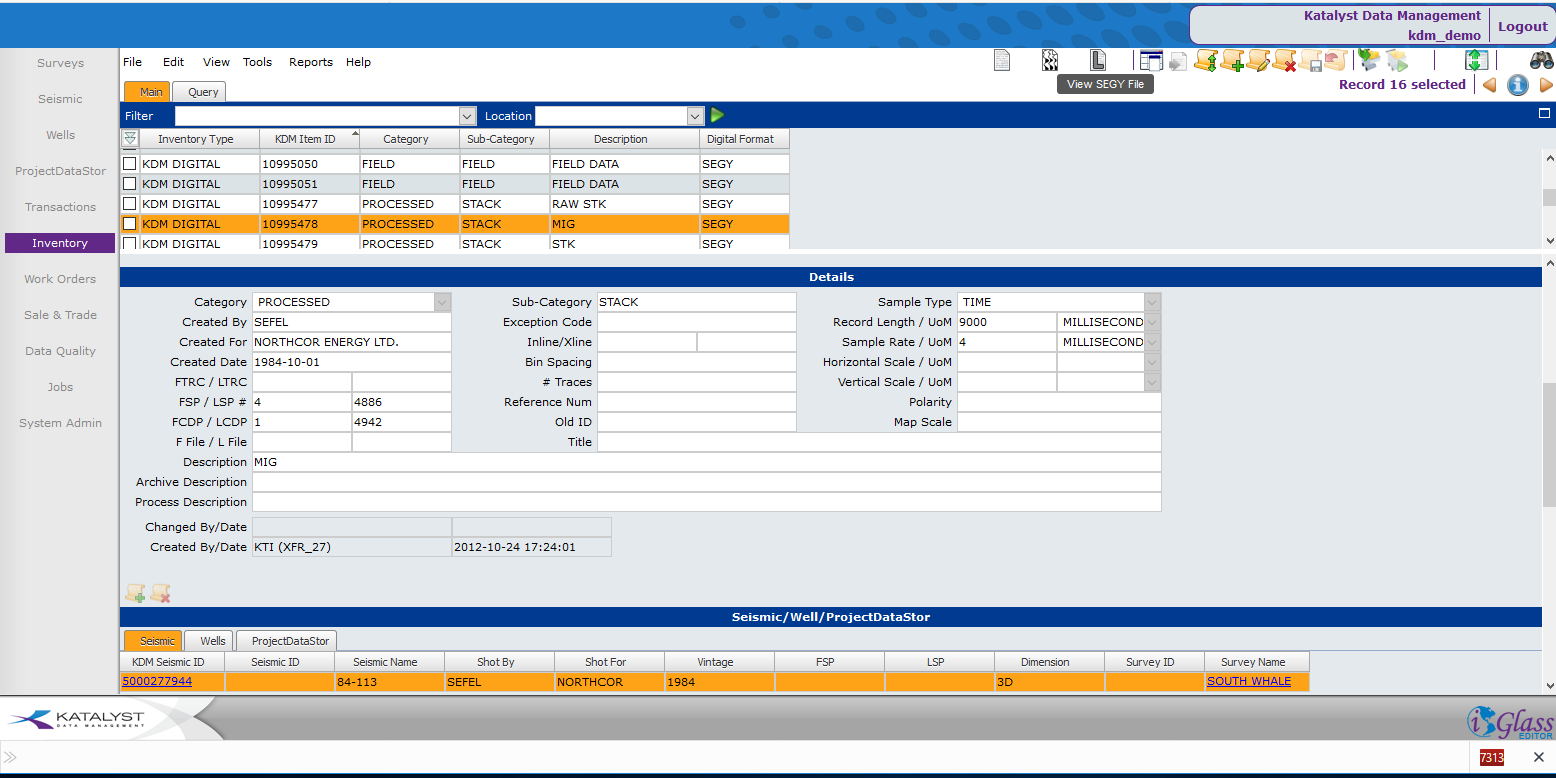
Katalyst knew INT’s visualization capabilities and reputation were well regarded in the industry, so working together to deploy a web-based visualization solution—within Katalyst’s iGlass—seemed a natural fit.
INT’s HTML5Viewer gave Katalyst the ability to manage and display seismic and well log data in the same platform, in one single interface, creating a seamless user experience and workflow for their clients. The resulting visualizations are fast, high quality, and accessible from anywhere.
Typically, data management platforms allow users to request or order data, but it may be days or even weeks before they receive it. Sometimes that data is inaccurate, incomplete, or just not what the client needed. For Katalyst’s clients, however, HTML5Viewer eliminates that uncertainty and significantly reduces time spent searching for the correct subsurface data.
See how HTML5Viewer can help you achieve your objectives with a free demo.