• Skip to main content
  • Skip to footer

INT

Empowering Visualization

COMMUNITY BLOG
CONTACT US SUPPORT
MENUMENU
  • Products
    • IVAAP™
          • SOLUTIONS

            Real-Time Visualization

            OSDU Visualization

            Visualization Components

            New Energy

          • SUCCESS STORIES

            WEATHERFORD
            Well delivery optimization software

            BARDASZ
            Data management, data quality monitoring

            ANPG / SATEC-MIAPIA
            Virtual data room

            MAILLANCE
            High-performance visualization of ML algorithms

            SEE ALL >

          • SUPPORT

            DEVELOPER COMMUNITY
            Join or log in to the INT Developer Community.

            GET SUPPORT
            Log a ticket for an issue or bug.

            CONTACT US

          • DEMOS

            IVAAP DEMOS
            Cloud-Based Demos

            FIRST TIME HERE?
            Register to access our
            IVAAP demos

    • GeoToolkit™
          • SUCCESS STORIES

            STRYDE
            Fast seismic QA/QC in the field

            SILVERTHORNE SEISMIC
            Efficient 2D/3D seismic data delivery

            WIRELESS SEISMIC
            Drones, IoT, and Advanced Onsite Seismic Data Validation

            SEE ALL >

          • SUPPORT

            GET SUPPORT
            Log a ticket for an issue or bug.

            CONTACT US

          • PLUG-INS

            EXTEND INTVIEWER
            More than 65 plugins available

    • INTViewer™
          • SUCCESS STORIES

            CAYROS
            Field development planning

            TOTALENERGIES
            High-performance large dataset reservoir rendering

            IFP ENERGIES NOUVELLES
            Seismic and structural interpretation validation

            SEE ALL >

          • SUPPORT

            DEVELOPER COMMUNITY
            Join or log in to the INT Developer Community.

            GET SUPPORT
            Log a ticket for an issue or bug.

            CONTACT US

          • DEMOS

            GEOTOOLKIT DEMOS
            Geoscience Demos

  • Demos
    • GeoToolkit Demos
    • IVAAP Demos
  • Success Stories
  • Solutions
    • Overview
    • Real-Time Visualization
    • Visualization Components
    • New Energy Visualization
    • OSDU Visualization
    • For E&P
    • For Cloud Partners
    • For Machine Learning
    • For Enterprise
    • Tools for Developers
    • Services Overview
  • Resources
    • Blog
    • Developer Community
    • FAQ
    • INT Resources Library
  • About
    • Overview
    • News
    • Events
    • Careers
    • Meet Our Team
    • About INT
iStore Uses INT GeoToolkit.JS
CUSTOMER
iStore

WEBSITE
istore.com

INDUSTRY
Geoscience

INT PRODUCT
GeoToolkit.JS

iStore and INT:

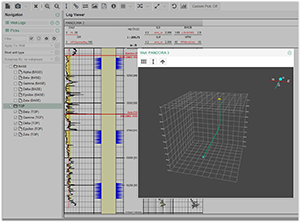
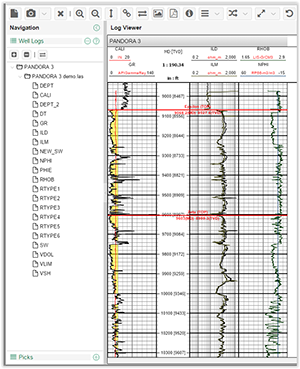
HTML5 Wellbore Tool for PetroTrek® and Quick Value Assessment (QVA®) products.

Overview

The Information Store (iStore) is a petrotechnical services company that offers comprehensive tools to analyze the abundance of integrated and vital exploration and production data in the oil and gas industry. With nearly 25 years of experience, iStore has grown to possess some of the most advanced web-based data access and visualization technologies available in the industry, customized to fit customers’ evolving needs. Learn more at www.istore.com.

Challenge

iStore developed PetroTrek and QVA web-based tools for managing and analyzing upstream data. Since these tools required high-performance web-based visualization of wellbore data, the tool needed to be able to handle individual or multiple wells, as well as display a variety of downhole data and well log curves. Previous versions of its wellbore tool used Microsoft Silverlight, a plugin technology that has been deprecated. iStore wanted to develop a new version of its wellbore visualization tool that took advantage of the new HTML5 capabilities supported in modern web browsers. At the same time, iStore wanted to have an updated, easy to use and fully interactive user interface.

INT Solution

iStore’s PetroTrek and QVA reserves analysis software are both built and configured using web-based technologies. To speed up the development of its new wellbore tool, iStore used INT’s GeoToolkit.JS HTML5-based libraries to avoid starting from scratch. GeoToolkit.JS includes many features specifically designed for handling and displaying well log curves. The library is well documented with extensive examples, which allowed iStore to quickly understand the capabilities of the INT toolkit and significantly reduce the time needed to develop a variety of new wellbore and well log visualization features.

With the help of GeoToolkit.JS, iStore was able to develop new wellbore and log visualization tools rapidly, allowing the Company to focus on core functionality rather than the underlying HTML5 technologies. iStore now offers more features, like PDF output, in its improved wellbore tool and plans to incorporate newer ones as INT continues to enhance GeoToolkit with further capabilities such as 3D log display.

See how GeoToolkit.JS can help you achieve your objectives with a free 30-day trial.

Request your GeoToolkit.JS trial

Footer

Solutions

  • Real-Time Visualization
  • Visualization Components
  • New Energy Visualization
  • OSDU Visualization
  • For E&P
  • For Cloud Partners
  • For Machine Learning
  • For Enterprise
  • Tools for Developers
  • Customer Success Stories

Products

  • IVAAP
  • GeoToolkit
  • INTViewer
  • IVAAP Demos
  • GeoToolkit Demos

About

  • News
  • Events
  • Careers
  • Management Team

Resources

  • Blog
  • FAQ

Support

  • JIRA
  • Developer Community

Contact

INT logo
© 1989–2023 Interactive Network Technologies, Inc.
Privacy Policy
  • Careers
  • Contact Us
  • Search

COPYRIGHT © 2023 INTERACTIVE NETWORK TECHNOLOGIES, Inc