• Skip to main content
  • Skip to footer

INT

Empowering Visualization

CONTACT US SUPPORT
MENUMENU
  • Products
    • Overview
    • IVAAP™
    • INTViewer™
    • GeoToolkit™
    • Product Overview
  • Demos
    • GeoToolkit Demos
    • IVAAP Demos
  • Success Stories
  • Solutions
    • Overview
    • For E&P
    • For OSDU Visualization
    • For Cloud Partners
    • For Machine Learning
    • For CCUS
    • For Geothermal Energy
    • For Wind Energy
    • For Enterprise
    • Tools for Developers
    • Services Overview
  • Resources
    • Blog
    • Developer Community
    • FAQ
    • INT Resources Library
  • About
    • Overview
    • News
    • Events
    • Careers
    • Meet Our Team
    • About INT

INTViewer

Jul 21 2017

A Closer Look at Coordinate Conversions

The CRS chooser when you type “World Mercator” in the search box

INTViewer makes coordinate conversions virtually transparent to users. Users pick two Coordinate Reference Systems (CRS), one for their data and one for the visualization map, and the visualization updates automatically.

How does INTViewer do it? The short answer is “it depends”. The long answer is that the strategy used varies based upon the CRSs selected, and the points to convert. To explain this, a better understanding of CRSs is needed: Coordinate Reference Systems are essentially defined as an origin, a bounding box, and a mathematical formula to convert each point to LAT-LONG coordinates.

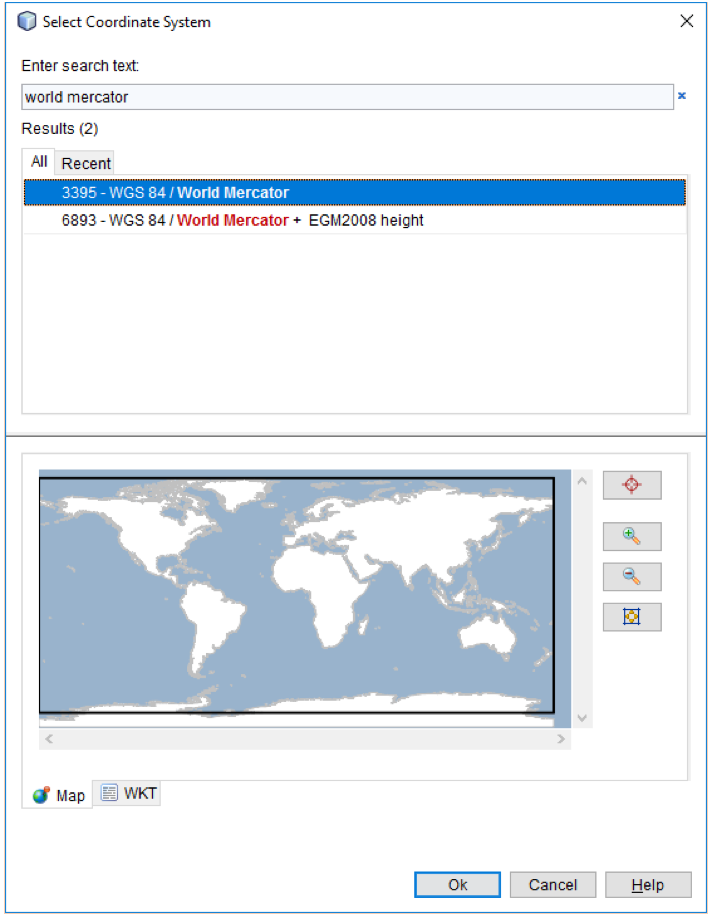
A well-known CRS is the Mercator projection spanning the entire globe (except the poles) and using LAT-LONG coordinates with Greenwich, UK as its origin. This CRS is known in INTViewer as “WGS 84 / World Mercator”.

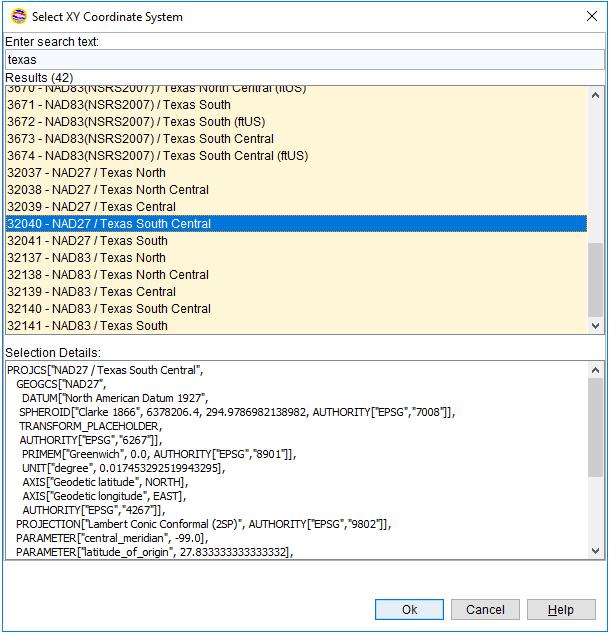
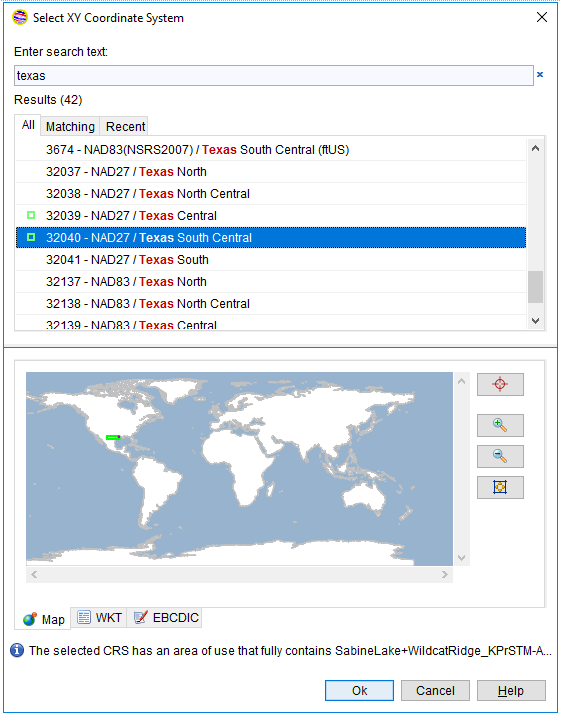
There are thousands of well-known CRSs used all over the world; this is only one of them. The European Petroleum Survey Group (EPSG) was formed in 1986, and maintains the list of these CRSs. This group provides a database of CRSs to all subscribers and this database is exported in the form of XML files to INTViewer. When you pick a CRS, you are essentially going through that exported list of CRSs.

When INTViewer converts coordinates between two CRSs, one strategy is to use WGS 84 as a hub. This means that we first convert coordinates from the first coordinate system to the WGS 84 coordinate system, then we convert the resulting coordinates to the second coordinate system. Unfortunately, this cannot be done with the CRS definitions alone; a “transform to WGS 84” needs to be specified for the conversion to WGS 84.

WGS 84 as a transformation hub


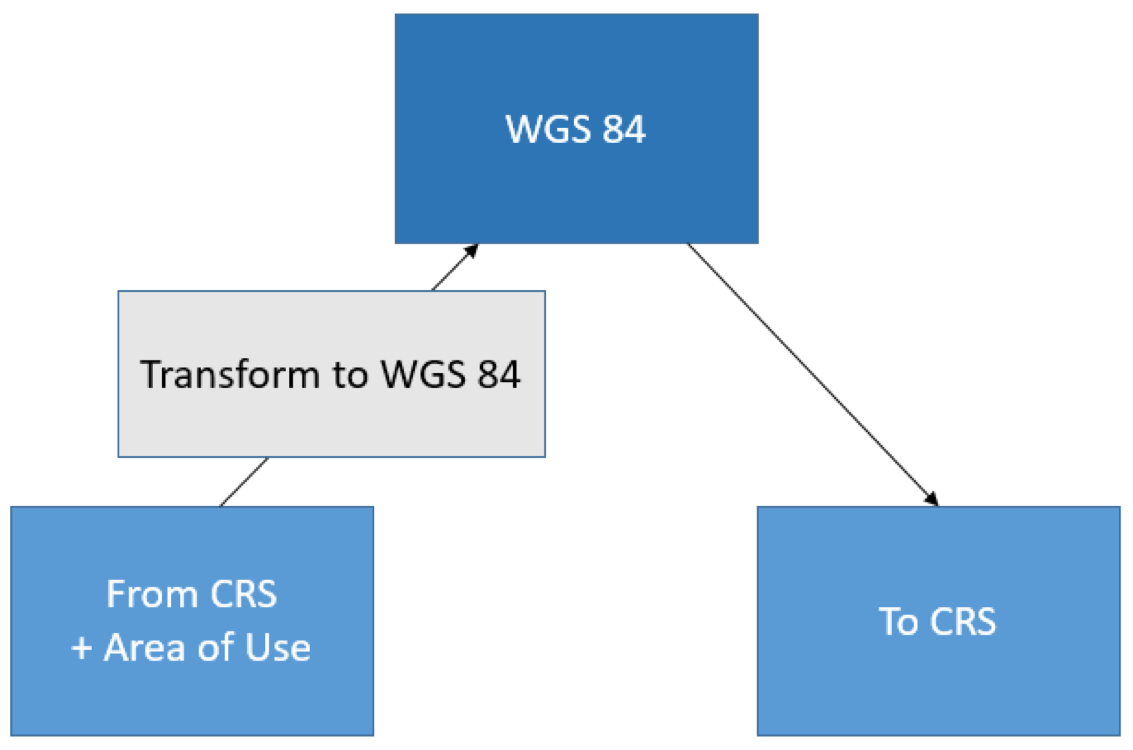
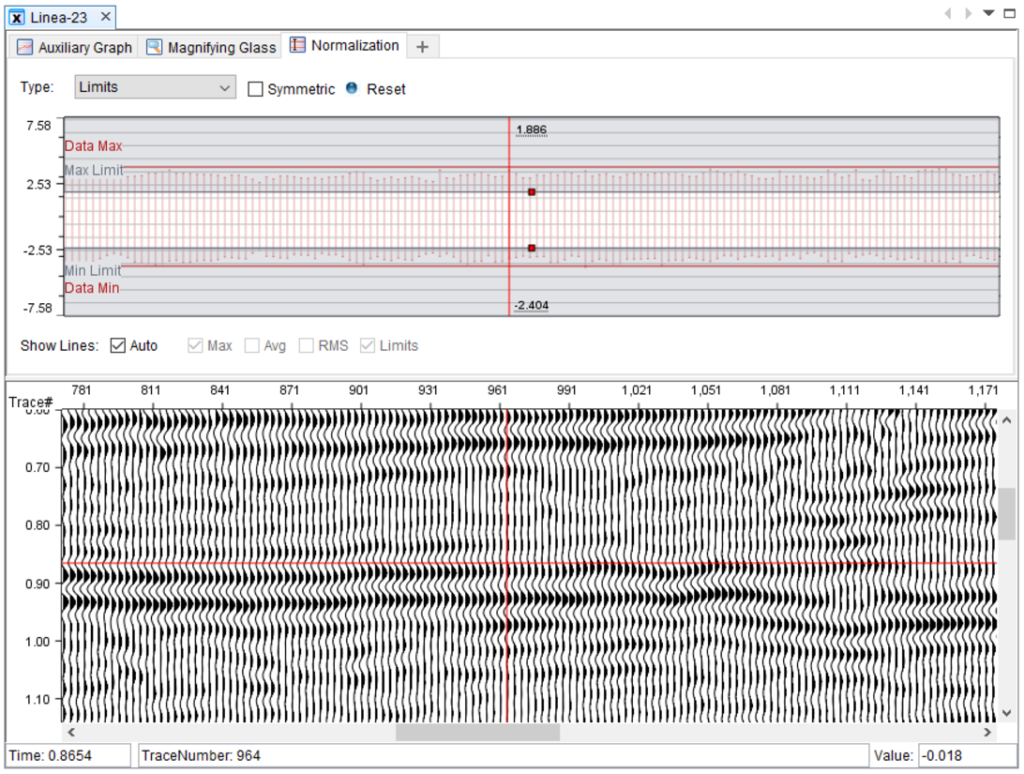
By default, INTViewer doesn’t prompt for that transform even where there are several possible options. INTViewer picks the transform to WGS 84 automatically based upon the bounding box of the points to convert. Each transform has its own “area of use” and INTViewer tries to pick the transform that has the smallest area of use but still contains all points to convert.

The CRS options panel


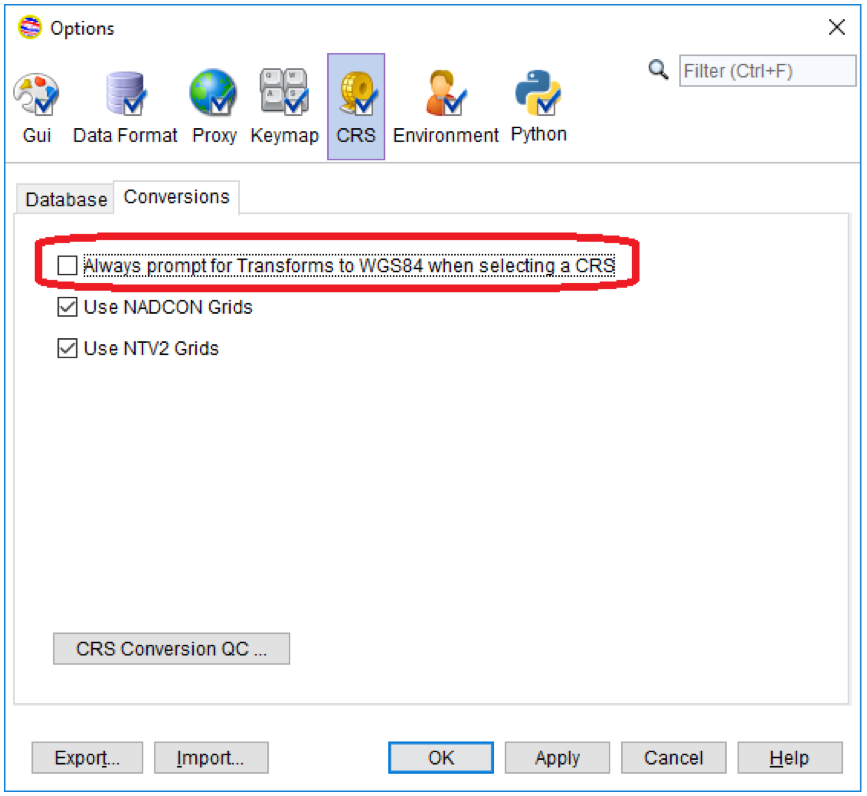
Users can elect to pick transforms manually by checking the highlighted option in the CRS options panel.

The “WGS 84 hub” technique is an easy way to convert coordinates between any two CRSs, but this is not the most accurate method, as it can introduce errors of more than 10 meters. For really accurate conversions, NADCON (North American Datum CONversion) and NTV2 (National Transformation Version 2) grids are a better option.

In a few words, NADCON and NTV2 grids allow much more precise conversions between two CRSs that have overlapping bounding boxes. NADCON and NTV2 grids are not defined for the entire planet, only specific areas of interest like North America, Europe, Australia, or the Middle East. As a result, INTViewer will use the WGS 84 technique as a fallback only if NADCON or NTV2 grids are not defined.

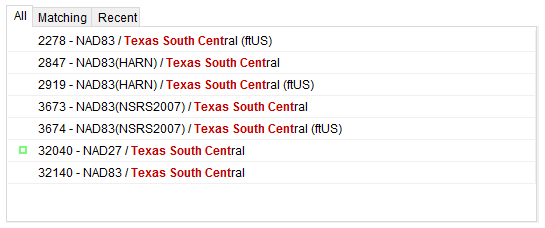
North America typically uses two different datums: NAD27 and NAD83. NAD27 and NAD83 are two geodetic reference systems, one created in 1927, the other in 1983. In 1989, U.S. states started defining High Accuracy Reference Networks (HARN) using GPS technology, making it possible to convert coordinates to LAT-LONG without a loss of precision of more than one meter. To take advantage of this precision, INTViewer attempts to use HARN-based conversions when possible.

In conclusion, the strategy to convert coordinates is highly based on the area of use (the bounding box) of the points to convert. If these points are found to be outside of a NADCON or NTV2 area, WGS 84 will be used as a hub. HARN may be used within the NADCON areas.

INTViewer has been evaluated against the OGP Geospatial Integrity of Geoscience Applications (GIGS) compliance guidelines and found to be compliant in 2013. The International Association of Oil&Gas Producers (OGP) created these guidelines to eliminate common failures of geospatial integrity in geoscience software applications.

While not a pure mapping software, INTViewer tries to find the right mix between ease of use and accuracy. The accuracy is good enough that it can be used to manage exclusion zones in seismic data, as demonstrated by the Mineral Rights plugin. As a developer, you can leverage this conversion mechanism in your own plugin without worrying about the implementation details.

Check back soon for more new features and tips on how to use INTViewer or contact us for a demo.


Filed Under: INTViewer Tagged With: CRS, INTViewer, mapping

Apr 18 2017

Extend INTViewer with Java

The inspiration for this blog comes from this poster that was recently added to our walls at the office.

So, how does INTViewer help developers empower users?

INTViewer provides many features off-the-shelf, but its extensibility is unique. Developers can customize numerous aspects of INTViewer by extending the INTViewer platform. And one way to extend this platform is to write Java plugins.

Here’s an example: INTViewer 5.2 has a new feature called Auxiliary Widgets which allows content to be displayed above XSection windows. I also mentioned this feature when I introduced the Normalization widget.

An example of the auxiliary widget allowing interactive limits normalization
Because INTViewer is an extensible platform, customers can add their own widget to the set already built in, meaning they can write their own widget for XSection windows.

We maintain a dedicated site for developers to find tutorials and other reference material to learn how to write plugins. For example, here’s the step-by-step guide to help developers add their own auxiliary widget.

The “Statistics” auxiliary widget added by plugin

What’s remarkable about this example is that it only takes three small files to plug this fully functional feature. Meaning that not only is INTViewer an extensible platform, but it is also a platform that is simple to extend. We spent many hours on the public API to make sure it is easy to understand and easy to use, yet powerful.

Now, why is the ability to add content on top of XSection windows valuable? Hardware vendors are one example of a company that would want to leverage this feature. Companies who sell acquisition hardware need to provide a tool for their customers to visualize the proprietary data captured by their instruments. The auxiliary widgets area is an ideal place for showing additional data specific to acquisition hardware. As end users visualize a seismic dataset recently captured, they also visualize vital parameters of the acquisition session without having to open another dialog or window.

Extending INTViewer is a broad topic, impossible to cover in just one post, so check back often for more articles on this topic and more. Or to get started with plugins, check out this architecture article.

Check back soon for more new features and tips on how to use INTViewer or contact us for a demo.


Filed Under: INTViewer Tagged With: INTViewer, widgets, XSection

Apr 18 2017

Choosing the Right Coordinate Reference System

INTViewer has been around for quite a while now. And over the last 8 years that I have worked on it, it has evolved a lot. As more and more users used the application, we were able to solicit and integrate their feedback, further maturing the application.

Sometimes, however, you don’t need to add new features to make a software great — just revisiting a design can sometimes add value. For INTViewer, the Coordinate Reference System (CRS) selection dialog is one of the areas we improved just by tweaking the design.

The most often used window of INTViewer is the XSection. When we surveyed our customers, we found that many didn’t know about the mapping capabilities of INTViewer. This is a shame since INTViewer makes it very easy to visualize your survey from a bird’s eye view in the map window.

To integrate satellite imagery and view your survey in context, you need strong coordinate reprojection capabilities. Five years ago, we worked to make INTViewer GIGS (Geospatial Integrity of Geoscience Applications) compliant. Actually, most of the work was done in J/CarnacGIS, a Java library designed for the visualization of Geographic Information System (GIS) data. INT developed this product separately, but it is included in INTViewer. I leverage its API often when I develop plugins, and customers do, too. CRS conversions done with INTViewer are very accurate — they use NADCON (North American Datum Conversion) and NTV2 (National Transformation version 2) grids when available. But a key to a valid conversion from one CRS to another is to pick the right CRSs in the first place!

Up until INTViewer 5.1.1, the CRS selection dialog looked like this:

This dialog essentially listed all CRS in the European Petroleum Survey Group (EPSG) database, prompting the user to choose the right code … among approximately 2,000 codes.

In INTViewer 5.2, the user interface has been enhanced to show a map that highlights the area of use of the CRS you are selecting:

When you perform quality analysis of your data before sending it for interpretation, you want to make sure that it is properly geolocated. This dialog allows you to check that the CRS you are picking is in the right region, and it highlights its area of use. If your data falls outside of this area of use, the validity of CRS conversions is compromised, leading to invalid visualizations.

INTViewer compares the bounding box of your data with the bounding box of the area of use. If the area of use fully contains your data, a green badge will be shown next to the CRS and in the map.

If there is only a partial match, a yellow badge will be shown.

This is a simple way to validate your selection. The CRS selection feature itself hasn’t changed, but the user experience has improved.

Users who work primarily on one survey won’t be affected by this change: they know by heart which CRS their survey uses. For me, as I often switch from one survey to another when I perform demos, this makes my task much simpler as I don’t always remember the EPSG code I need to enter. Customers who use INTViewer as a presentation tool (for example to showcase acquisition surveys) should also benefit.

Check back soon for more new features and tips on how to use INTViewer or contact us for a demo.


Filed Under: INTViewer Tagged With: CRS, INTViewer, XSection

Apr 17 2017

Microsoft Azure + INTViewer

Yesterday, I was invited to the Microsoft offices in Houston to install a demo of INTViewer. Microsoft advocates for solutions that are hosted on the cloud, and I found that INTViewer fits this model well.

The cloud is not just a set of computing resources hosting web based-applications. Microsoft Azure can also be used to host what we know today as desktop PCs. Constant availability and unlimited storage are just two of the numerous advantages of hosting your PC on the cloud.

To access our “PC in the cloud,” you only need a lightweight appliance hooked to a keyboard, a mouse and a monitor. An example of such appliance is the “Teradici Zero Client.” What’s different between a classic “Remote Desktop Solution” and Teradici’s solution is how rendering is implemented. Network latency can get in the way of the user experience if not done right. Teradici’s network protocol makes remote interaction seamless. This is important for INTViewer: At its core, INTViewer is a visualization application. Users typically have several large monitors to work with their data, which means a lot of pixels to transport.

A key to application performance is to keep your data and your visualization software close to each other. Once you put your geoscience data in Microsoft Azure, INTViewer allows instant visualization of that data. The reason why INTViewer is a good fit for that setup is that it’s a relatively lightweight application. Unlike large interpretation software, you typically only need 1 to 4 GB of memory to run. And it’s a snap to install.

It’s quite a leap to decide to move terabytes of data to Microsoft Azure, and INTViewer is only one factor to that decision. However, there is one immediate use case for Microsoft Azure and INTViewer: INTViewer is a great tool for presentations. The slideshow plugin allows businesses to prepare presentations, each slide showing a particular aspect of a survey. I mocked up in a few minutes a presentation of the well-known Alwyn dataset. This presentation included visualization of a seismic survey and how it relates with wells and the reservoir model. For good measure, I added a spectrum analysis and a numerical view of log curves. The entire data underlying that presentation was only 10GB, easy to copy to Microsoft’s cloud at a moment’s notice.

This opens a new way to use INTViewer. Some of our customers use laptops to showcase acquisition data to potential clients. With a cloud-based solution, the burden of copying the data to each laptop disappears — you only need to copy it once to the cloud.

I was particularly proud of how well the slideshow plugin performed. Navigating through Alwyn became as simple as flipping through Powerpoint slides. But unlike a static presentation, attendees can interact with the data on demand. If a problematic data point is identified, it is easy to zoom, perform a live QA of that data, answer questions, and then move on to the next topic.

Check back soon for more new features and tips on how to use INTViewer or contact us for a demo of INTViewer in the cloud.


Filed Under: INTViewer Tagged With: cloud, INTViewer, Microsoft

Apr 16 2017

Simple Usability Features for Desktop Applications

My day-to-day workstation is a Windows PC. It has a good GPU, but otherwise, it’s a fairly normal computer. I use NetBeans IDE all the time. I also use Microsoft Word and Excel, but I find that there is still room to improve: The user interface is still overly driven by the file system. I constantly switch between applications, often repeating the same steps to point each application to where my files might be, either in My Documents, Downloads, Data, or Desktop.

INTViewer is an application that is very file-driven. Once you launch INTViewer, most likely your next interaction will be to designate the location on disk of a file to load, whether that file is a seismic dataset, an INTViewer session, or a slideshow. Likewise, as you save renderings to image files, or as you export sample values to Excel, you will need to designate a location on disk for your output.

Microsoft Windows has a standard dialog to choose and save files, but this is not an optimal way to navigate your file system from within your application because this dialog hides your content while you are choosing a path on disk. INTViewer addresses this by offering to open the directory where you just saved a file.
 

The notification that appears in INTViewer once you save a session file.
 
The idea is to make the application aware of the user workflow, anticipate it, and facilitate it. If you save a session file, your next step might be to share it with others. How many times have you saved a file and wondered the next second where you just saved it? Opening the directory where this file resides makes this next task easier. INTViewer’s non-blocking notification is not intrusive: users can ignore it, and there’s no “cancel” button to press to shoo a pesky dialog away.

(I often wish Notepad had this feature. In fact, I wish ALL desktop applications had this feature. It’s really simple to implement and would make my day-to-day tasks that much easier.)

One benefit that desktop applications have over web applications is productivity. A power user often loads files from the same directories. As a result, the path of these directories is well-known. This is especially true for Linux users. Why not facilitate the entry of these paths? Here is an example of field where a file path needs to be entered.

For power users, the “choose” button should only be a fallback. Otherwise, it interrupts the flow. Typing the path directly would be a better option if only it were easier. The Python terminal has no choose button, so when we designed the autocompletion of Python scripts, we made it possible for users to enter a path interactively: just type Control+Space on your keyboard. With that, the file system becomes accessible at your fingertips, without a file chooser.
 

INTViewer Python scripting terminal
 

This is a simple feature, but very useful in this scripting context. Once we added it, we realized it would be quite simple to reuse in the context of path fields. Path fields in INTViewer 5.2 have the same contextual capabilities as the Python terminal.

Now that both of these features are in place, I use them all the time. In fact, I save so much time (and headache), I wish all of my other desktop applications worked this way.

Check back soon for more new features and tips on how to use INTViewer or contact us for a demo.


Filed Under: INTViewer Tagged With: INTViewer, python, script

  • « Go to Previous Page
  • Go to page 1
  • Interim pages omitted …
  • Go to page 3
  • Go to page 4
  • Go to page 5
  • Go to page 6
  • Go to Next Page »

Footer

Solutions

  • For E&P
  • For OSDU Visualization
  • For Cloud Partners
  • For Machine Learning
  • For CCUS
  • For Geothermal Energy
  • For Wind Energy
  • For Enterprise
  • Tools for Developers
  • Customer Success Stories

Products

  • IVAAP
  • GeoToolkit
  • INTViewer
  • IVAAP Demos
  • GeoToolkit Demos

About

  • News
  • Events
  • Careers
  • Management Team

Resources

  • Blog
  • FAQ

Support

  • JIRA
  • Developer Community

Contact

INT logo
© 1989–2023 Interactive Network Technologies, Inc.
Privacy Policy
  • Careers
  • Contact Us
  • Search

COPYRIGHT © 2023 INTERACTIVE NETWORK TECHNOLOGIES, Inc