New release delivers enhanced user experience for data search and data collection and higher performance for seismic, well data, and reservoir visualization in the cloud.
Houston, TX — INT announced today the availability of IVAAP™ 2.10, the latest version of the world’s leading subsurface data visualization platform for Energy data. IVAAP 2.10 delivers performance improvements to drive faster analysis and better data-driven business decisions.
This release features new integrations with key industry partners such as Schlumberger DELFI and Microsoft Energy Data Solutions to solidify IVAAP’s robust interoperability capabilities across platforms.
We see clearly an uptake in the number of operators starting to deploy the latest M13 version of OSDU on AWS, Azure, or IBM Red Hat OpenShift cloud platform. Many of these operators have selected IVAAP—a unique application that helps users search, select, visualize, and QC all the data that has been ingested natively into OSDU—as their visualization platform of choice.
“IVAAP is the most innovative digital workspace solution for the Energy industry. We foster strong, ongoing collaborations with major Energy companies and global solutions partners to facilitate true interoperability across the data ecosystem for our clients,” said Dr. Olivier Lhemann, president and founder of INT. “We are proud to be able to offer two new partnerships with this release and look forward to expanding our roster in the coming months.”
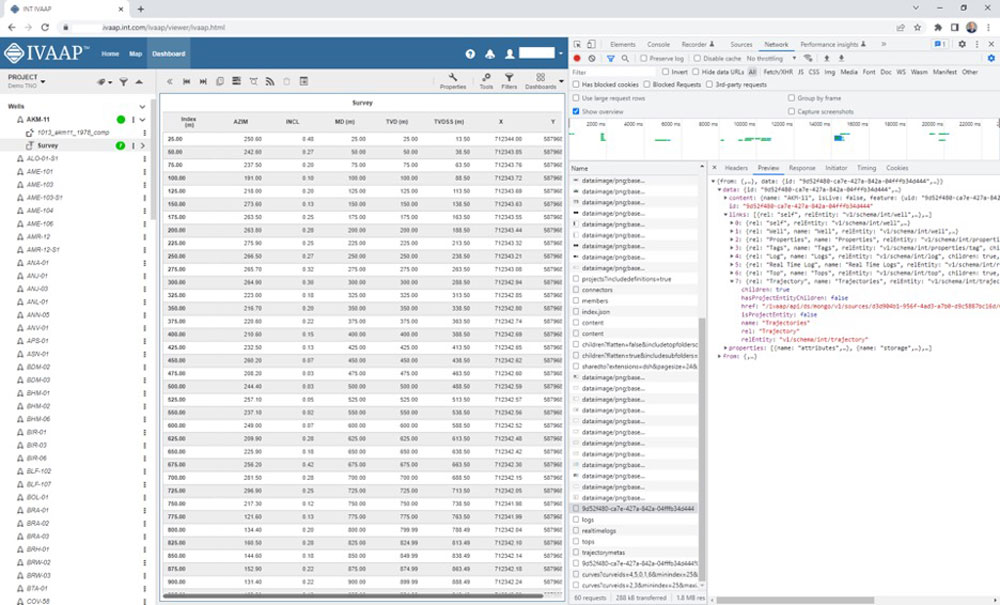
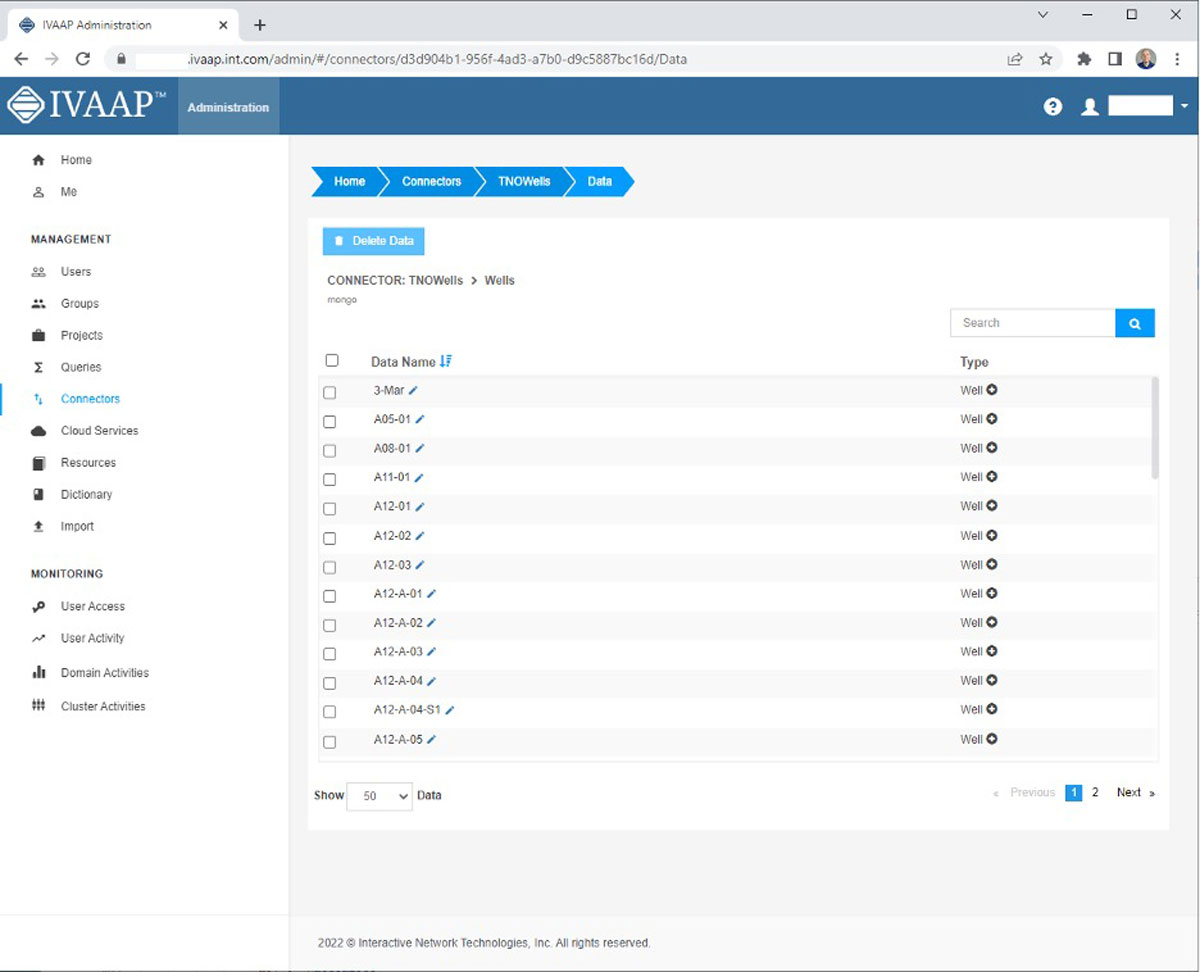
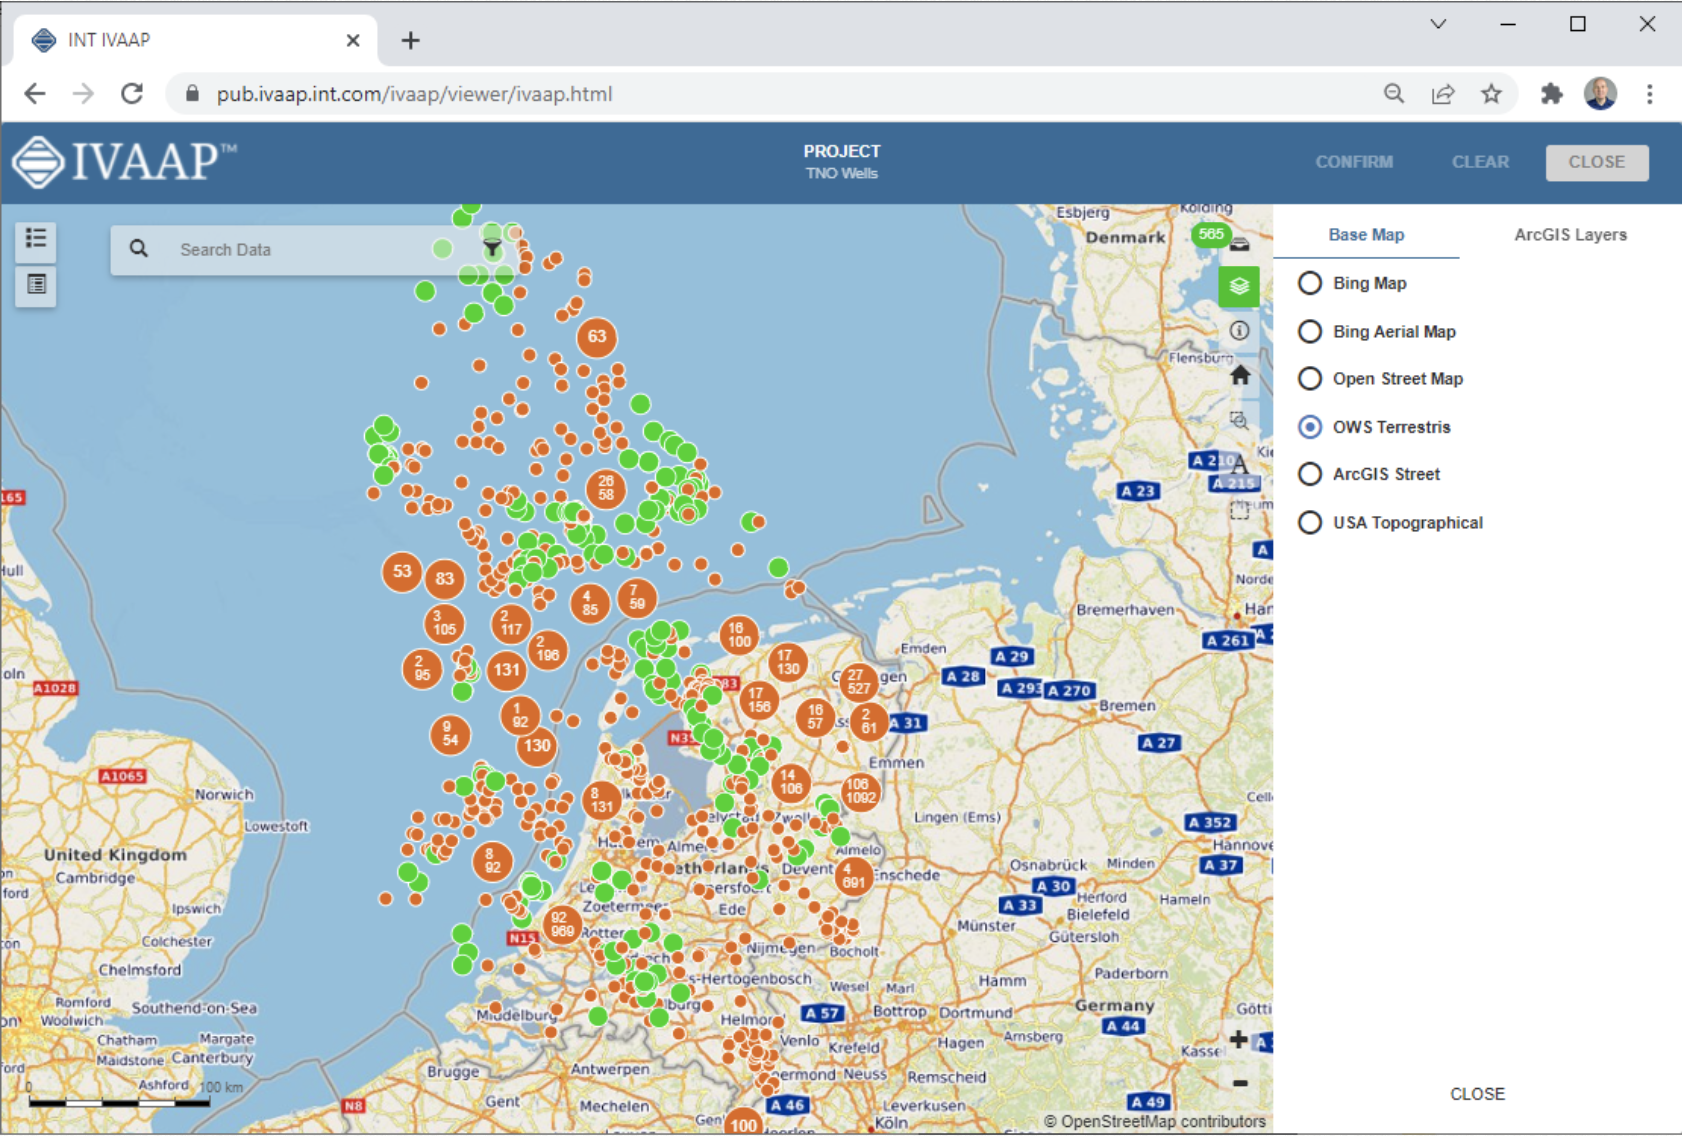
Accessing data should be a seamless part of any workflow, so IVAAP 2.10 includes new map-based search and data collection functionality to deliver a streamlined digital workspace to empower fast data discovery.
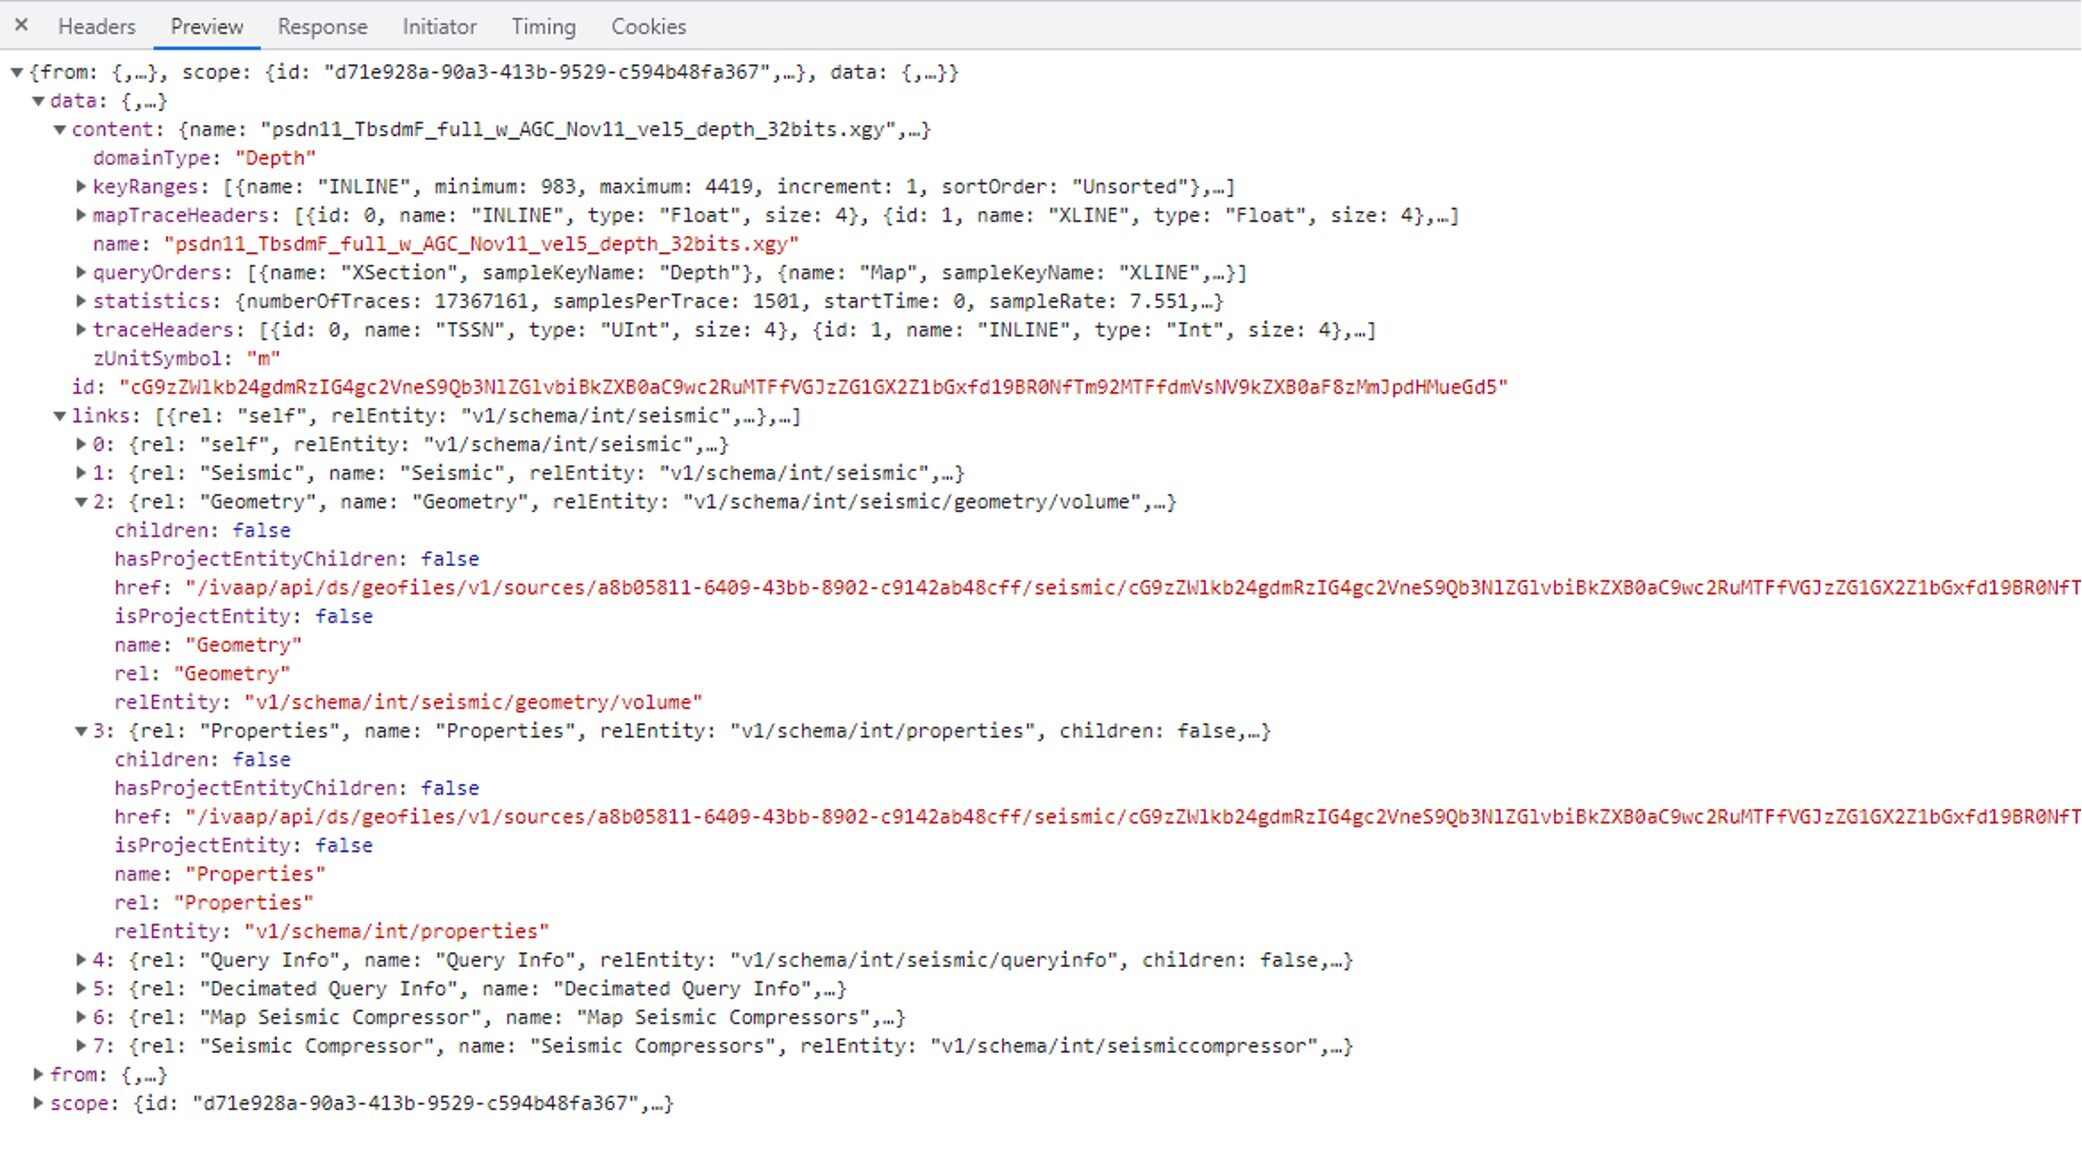
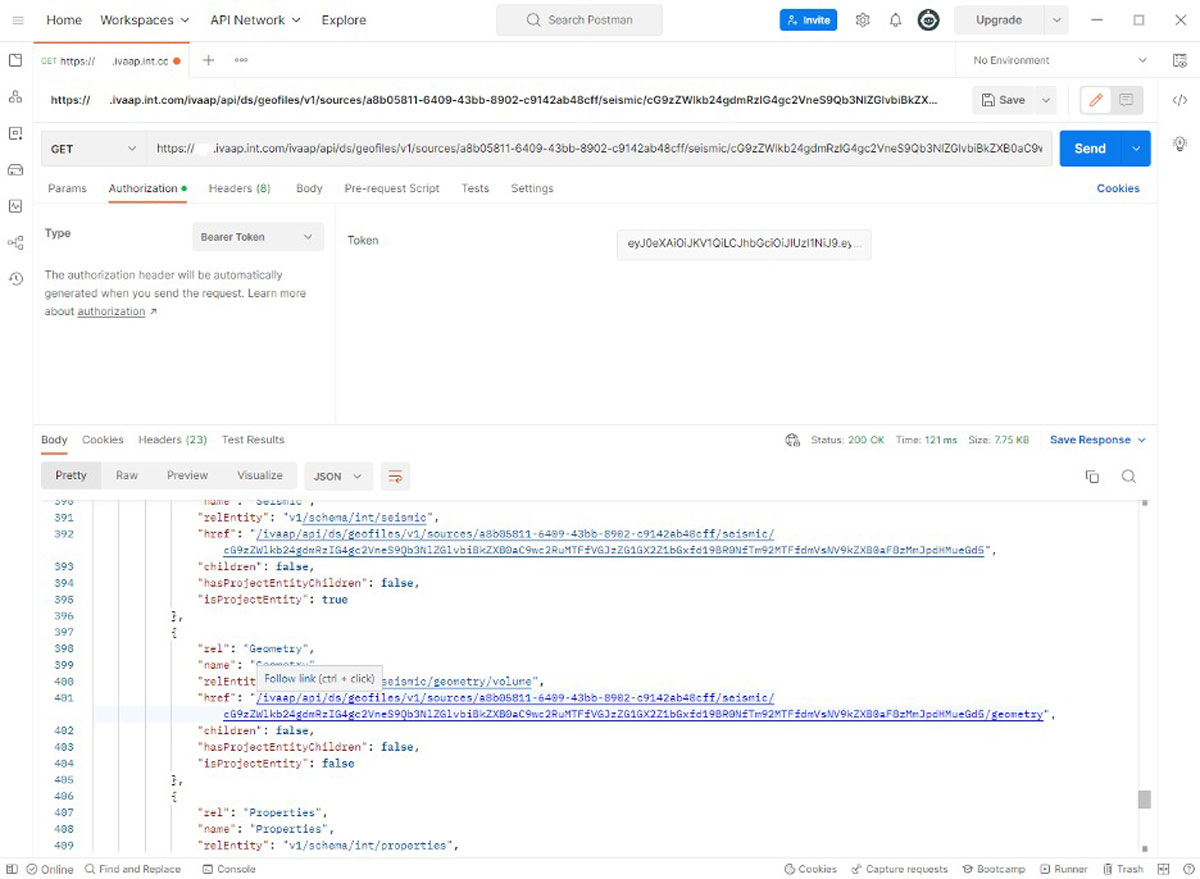
Seismic workflows within IVAAP gain a significant boost with this release, thanks to performance improvements for large 3D datasets, new peel and reveal functionality, and new arbitrary line editing. IVAAP’s reservoir visualization supports larger grid sizes, faster rendering in the cloud, and significant improvement in performance.
Visit us online at int.com/ivaap for a preview of IVAAP or for a demo of INT’s other data visualization products.
Read the full press release on PRWeb
For more information, please visit www.int.com or contact us at intinfo@int.com.
____________
ABOUT INT
INT software empowers energy companies to visualize their complex data (geoscience, well, surface reservoir, equipment in 2D/3D). INT offers a visualization platform (IVAAP) and libraries (GeoToolkit) that developers can use with their data ecosystem to deliver subsurface solutions (Exploration, Drilling, Production). INT’s powerful HTML5/JavaScript technology can be used for data aggregation, API services, high-performance visualization of G&G and energy data in a browser. INT simplifies complex subsurface data visualization.
For more information about IVAAP or INT’s other data visualization products, please visit https://www.int.com.
INT, the INT logo, and IVAAP are trademarks of Interactive Network Technologies, Inc., in the United States and/or other countries.